11.2 - Who has installed?

MikeyG

Patron
Joined
Dec 8, 2017
Messages
442
It should be in Storage -> Disks. Click the 3 dot button next to the disk to wipe. Post a screenshot if you don't have that.
1544125661935.png
 

MikeyG

Patron
Joined
Dec 8, 2017
Messages
442
Is the disk in use? It will not show a "wipe" option if the pool is not listed as "unused"
Yes, it is in use. I assume you mean if the disk is listed as unused, and not the whole pool? I'd hope I could wipe a disk without taking the pool offline. The old version did show it even if disk was online. Perhaps this is actually better than and working as expected. Just wanted to make sure I wasn't missing something. I'd rather not start offlining disks to test. Thank you!
 

Constantin

Vampire Pig
Joined
May 19, 2017
Messages
1,829
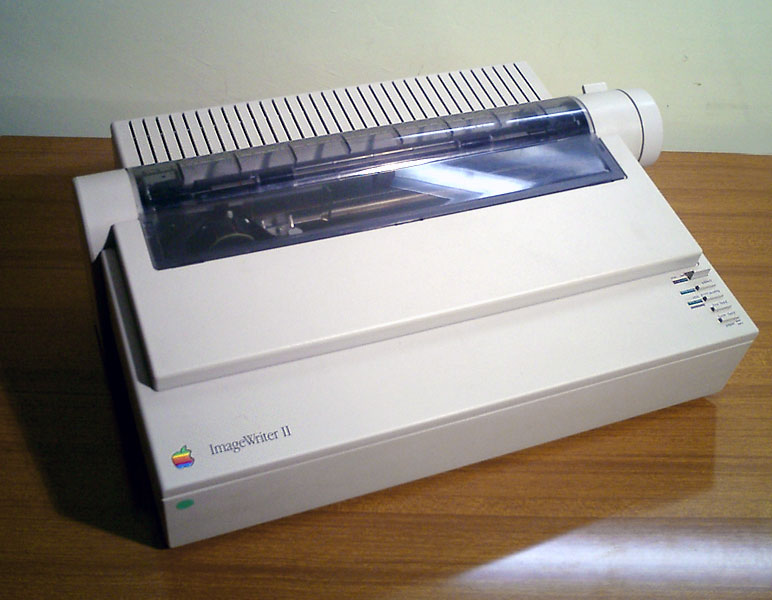
Haha, thought of a different ImageWriter when I saw that first. Ahh... good times!

Imagewriter_ii.jpg

(image courtesy of Wikipedia commons)
 

Michael Hanna

Dabbler
Joined
Jun 17, 2017
Messages
43
Got it installed and everything went smoothly. My existing warden jails and plugins are running (have to manage via legacy UI as expected). 10G nic is working. Lagg groups are working. Replication and rsync tasks are working. I have not upgraded my volumes yet. The CPU temp on the dashboard is not accurate as it starts at 30C and slowing drops to 0C and stays there. Other than that I've had no noticeable issues.
 

danb35

Hall of Famer
Joined
Aug 16, 2011
Messages
15,504
I'd thought I would wait a bit to install it, but went ahead anyway, upgrading from 11.1-U5. Generally went smoothly--system's back up, shares are working, new UI is running (defaulting to the iX Dark theme), all pretty much as expected. Some problems with the UPS support, though:
  • The "Port" field is mandatory, even when using a SNMP UPS (which isn't, by its nature, connected to any port at all).
  • It worked perfectly under 11.1-U5, but under 11.2 it's saying (and spamming the console with every five seconds) "connection refused."
 

babaroga

Explorer
Joined
Jul 22, 2012
Messages
50
CPU usage for HP Microserver N40L is stuck to 0% and not moving at all. Old LegacyUI shows the actual usage correctly.
 

file_haver

Explorer
Joined
Sep 19, 2018
Messages
55
Is it safe to upgrade directly from 11.1-u6 to this with plex?
 

Bonnie Follweiler

QA Technician
iXsystems
Joined
May 23, 2016
Messages
35
Yes, it is in use. I assume you mean if the disk is listed as unused, and not the whole pool? I'd hope I could wipe a disk without taking the pool offline. The old version did show it even if disk was online. Perhaps this is actually better than and working as expected. Just wanted to make sure I wasn't missing something. I'd rather not start offlining disks to test. Thank you!
You're welcome :D
 

MikeyG

Patron
Joined
Dec 8, 2017
Messages
442
Is there any way to disable all netdata email notifications? I'm getting bombarded by them now.
 

diskdiddler

Wizard
Joined
Jul 9, 2014
Messages
2,377
Is there any way to disable all netdata email notifications? I'm getting bombarded by them now.

Disable netdata, people have reported this for a long while. The thresholds need some adjustment.
 

MikeyG

Patron
Joined
Dec 8, 2017
Messages
442
Disable netdata, people have reported this for a long while. The thresholds need some adjustment.

I guess I wasn't clear. I was looking for a way to disable only email notifications. I do understand that disabling netdata completely would disable email notifications along with it. Before this update, I had never received any email notifications from netdata, so obviously something changed which caused me to get about 300 emails.

I'm not sure if this is the correct way to do it, but setting SEND_EMAIL="NO" in /usr/local/etc/netdata/health_alarm_notify.conf and restarting the service seems to have done what I was looking for.
 

MikeyG

Patron
Joined
Dec 8, 2017
Messages
442
I hate to be annoying, but for me the ZFS reporting graph doesn't quite look right. ARC shows up as 8215GB total, and my L2ARC is not visible on the graph at all. Tried removing and re-adding L2ARC from the pool but it didn't help. On the old interface it looks the way it used to, showing ARC and L2ARC on the same graph with the correct numbers. Am I doing something or looking at this wrong?

1544147272239.png
 

diskdiddler

Wizard
Joined
Jul 9, 2014
Messages
2,377
I guess I wasn't clear. I was looking for a way to disable only email notifications. I do understand that disabling netdata completely would disable email notifications along with it. Before this update, I had never received any email notifications from netdata, so obviously something changed which caused me to get about 300 emails.

I'm not sure if this is the correct way to do it, but setting SEND_EMAIL="NO" in /usr/local/etc/netdata/health_alarm_notify.conf and restarting the service seems to have done what I was looking for.


Oh no, I understood, but we have been reporting this for 3 months, Netdata seems very finicky, one week it's angry, nextr week it's fine. It's always emailing for one reason or another.

Let me clarify too, it was a LOT worse (!)
Just turn it off for the time being, I can't see this being fixed soon.
 

rudyamid

Cadet
Joined
Nov 6, 2018
Messages
7
I upgraded my test env from 11.2-RC2 to 11.2, was able to do it in about 20-30 minutes (slow CPU). But for my production one (RC2->Stable), it has a better CPU but the update is still running for 40 mins - seems to be stuck at 62.50% (installing base-os 1/4). I can see my USB stick flashing away, so it must be doing something. I'll let it go for a few more and see what happens...
 

Benc

Dabbler
Joined
Nov 5, 2015
Messages
37
Upgraded from 11.2-RC2, it was finished in a couple of minutes without problem.
 

rokh

Cadet
Joined
Aug 9, 2017
Messages
7
Did you check if smart is enabled on a usb drive? If so disable it on the drive and start smart.
There is a thread in the forum.

SMART has been disabled on all disks, including the boot USB. Service refuses to start.
 

ChaosBlades

Contributor
Joined
Jul 4, 2015
Messages
137
So far all issues are with Dashboard Memory Usage, CPU Usage, CPU Temp, and Load Average graphs.

All graphs can take a long time to load in.
CPU Usage graph is always 0% for me
CPU Temp, Memory Usage, and Load Average all drop off to 0 at the right end of the graph.
CPU Temp is not accurate. FreeNAS dashboard says 30-32C but netdata is 30-50 in the same time span.

Think it would be simpler to just have these graphs import the data straight from netdata but at current if they did work correctly it is still producing inferior data.
 
Top