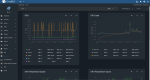
I am very new to FreeNAS. I have been trying to do my research and find the answers before I ask questions but this one seems to have me stumped. I finally got everything installed and configured. I was just sitting on the dashboard and noticed that my CPU usage was around 127%, seemed kinda off so I went to the server and checked and its fans are at an idle and the board I have does have a CPU Gauge built in to show current load (Board # and specs below) It was showing it was at an idle as well. I then started up a big file transfer and also a Time Machine backup and it showed the 127% usage again but I did notice the board was showing a slight increase to the cpu load as well as the fans kicked up a little. I haven't been able to find a way to reset this number or get it to calibrate better to the cpu, tried restarting and upgrading (no update found) but nothing seems to work. Just wondering if anyone has seen this or if there is a fix for the software version that I am on.
MotherBoard: Gigabyte GA-EX58-UD5
CPU: Intel Core i7 920 @ 2.67 GHz 8 Cores
Memory: 24 GB (6 @ 4GB)
Storage: 20 TB (10 @ 2TB) ( Setup in RAID Z1)
OS: FreeNAS 11.2 - U7 (Installed on 500 GB)
Raid card installed but all drives are mounted for passthrough so FreeNAS handles all RAID Functions. Was left over from an older build and needed the extra ports for the drives.
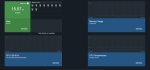
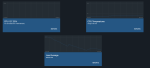
I have also attached some screenshots of what I am seeing.
MotherBoard: Gigabyte GA-EX58-UD5
CPU: Intel Core i7 920 @ 2.67 GHz 8 Cores
Memory: 24 GB (6 @ 4GB)
Storage: 20 TB (10 @ 2TB) ( Setup in RAID Z1)
OS: FreeNAS 11.2 - U7 (Installed on 500 GB)
Raid card installed but all drives are mounted for passthrough so FreeNAS handles all RAID Functions. Was left over from an older build and needed the extra ports for the drives.
I have also attached some screenshots of what I am seeing.