Hello,
In an initial search I couldn't find any other related post... so here it is:
I'm playing around with FreeNAS 11.2 (FreeNAS-11.2-RELEASE-U1 - Build Date: Dec 20, 2018 23:41) on an HP DL380 G6 (dual Xeon X5670 and 144GB of RAM).
I set it up using the onboard RAID controller (HP P410i). Since the RAID controller can only be configured in RAID-x, I have a hardware RAID5 volume that I use in FreeNAS as a stripe. I know it's not good but it's only for testing...
I'm not familiar with version 11.x (I'm still using 9.10) but I noticed a strange behavior in the reporting part of the web interface and I don't know if it's due to my browser/system/set-up (I tried with 2 different browsers including Firefox v64). I though I'll give some feedback here to see if it's only local.
So I go to Reporting, I select Disk.
There I have following devices: cd0; da0 and da1. I select da0 which is the striped (hardware RAID volume) and I select all metrics..
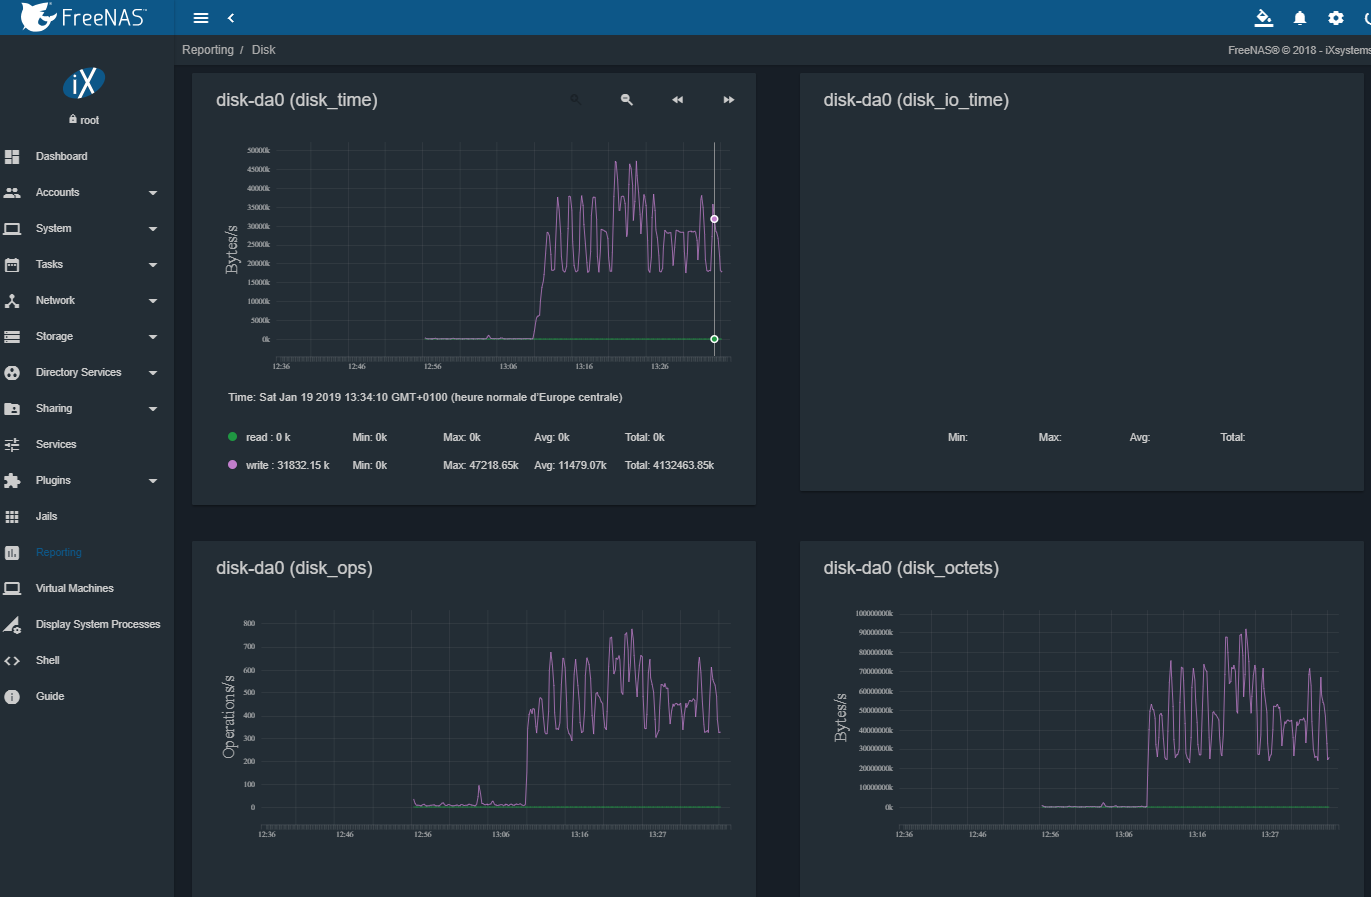
I get this:

Note that the disk_io_time graph is empty.
On the first graph (disk_time), I do see the cursor with the vertical bar and it displays the according timestamp (here Time: Sat Jan 19 2019 13:34:10 ....) and legend (read and write data) below the graph .
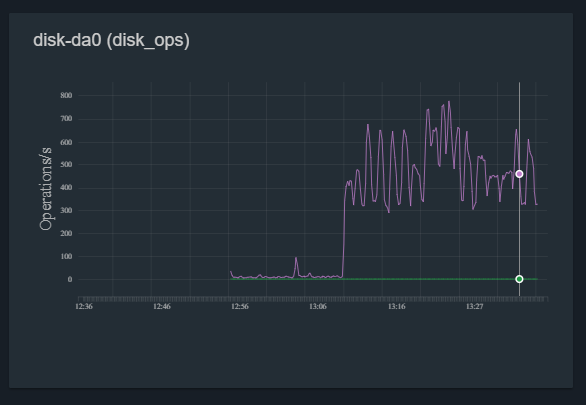
Now when I go over the disk_ops graph, the vertical bar is displayed but the the below timestamp and the legend aren't:

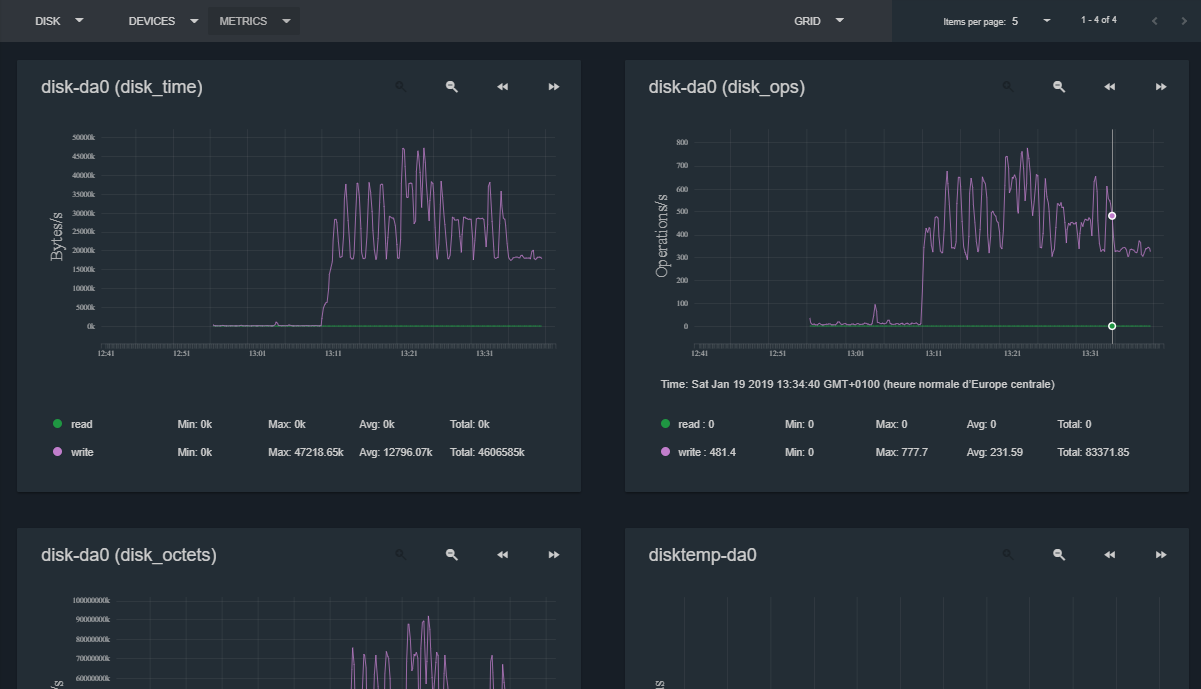
This seems to be because the second graph (disk_io_time) is empty: if in the metrics I deselect disk_io_time, all the graphs are displayed and behave correctly:

So nothing very important, only cosmetic and I just wanted to see if this behavior was specific to my system or not.
Thanks for your feedback.
In an initial search I couldn't find any other related post... so here it is:
I'm playing around with FreeNAS 11.2 (FreeNAS-11.2-RELEASE-U1 - Build Date: Dec 20, 2018 23:41) on an HP DL380 G6 (dual Xeon X5670 and 144GB of RAM).
I set it up using the onboard RAID controller (HP P410i). Since the RAID controller can only be configured in RAID-x, I have a hardware RAID5 volume that I use in FreeNAS as a stripe. I know it's not good but it's only for testing...
I'm not familiar with version 11.x (I'm still using 9.10) but I noticed a strange behavior in the reporting part of the web interface and I don't know if it's due to my browser/system/set-up (I tried with 2 different browsers including Firefox v64). I though I'll give some feedback here to see if it's only local.
So I go to Reporting, I select Disk.
There I have following devices: cd0; da0 and da1. I select da0 which is the striped (hardware RAID volume) and I select all metrics..
I get this:
Note that the disk_io_time graph is empty.
On the first graph (disk_time), I do see the cursor with the vertical bar and it displays the according timestamp (here Time: Sat Jan 19 2019 13:34:10 ....) and legend (read and write data) below the graph .
Now when I go over the disk_ops graph, the vertical bar is displayed but the the below timestamp and the legend aren't:
This seems to be because the second graph (disk_io_time) is empty: if in the metrics I deselect disk_io_time, all the graphs are displayed and behave correctly:
So nothing very important, only cosmetic and I just wanted to see if this behavior was specific to my system or not.
Thanks for your feedback.
