12. Reporting
Reporting displays several graphs, as seen in Figure 12.1. Click the tab for a device type to see those specific graphs.
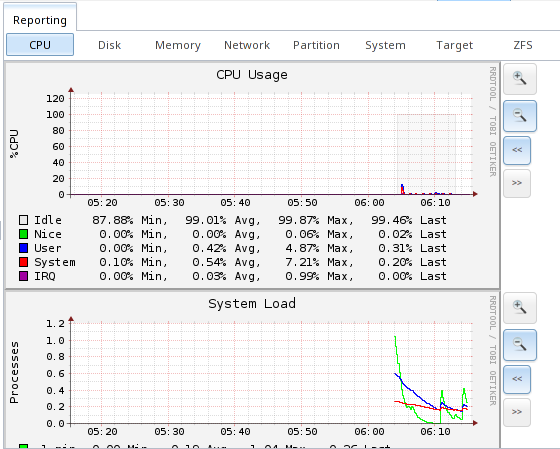
Fig. 12.1 Reporting Graphs
TrueNAS® uses collectd to provide reporting statistics. The resulting graphs are grouped into several tabs on the Reporting page:
- CPU
- CPU shows the amount of time spent by the CPU in various states such as executing user code, executing system code, and being idle.
- Disk
- Disk shows statistics on I/O, percent busy, latency, operations per second, pending I/O requests, and disk temperature.
- Memory
- Network
- Interface shows received and transmitted traffic in bits per second for each configured interface.
- Partition
- Disk space displays free and used space for each volume and dataset. However, the disk space used by an individual zvol is not displayed as it is a block device.
- System
- Processes and Uptime displays the number of processes. It is grouped by state.
- Uptime keeps track of the system uptime, the average running time, and the maximum reached uptime.
- Target
- Target shows bandwidth statistics for iSCSI ports.
- ZFS
- ZFS shows compressed physical ARC size, hit ratio, demand data, demand metadata, prefetch data, and prefetch metadata.
Reporting data is saved to permit viewing and monitoring usage trends over time. This data is preserved across system upgrades and restarts.
Data files are saved in /var/db/collectd/rrd/.
The reporting data file recording method is controlled by the Reporting database option. When deselected, data files are recorded in a temporary filesystem and copied hourly to on-disk files.
When Reporting database is enabled, data files are written directly to the System Dataset.
Warning
Reporting data is frequently written and should not be stored on the boot pool or boot device.
Use the magnifier buttons next to each graph to increase or decrease the displayed time increment from 10 minutes, hourly, daily, weekly, or monthly. The << and >> buttons can be used to scroll through the output.
Update on using Graphite with FreeNAS contains instructions for sending the collected information to a Graphite server.