gabrielpc1190
Cadet
- Joined
- Jul 18, 2012
- Messages
- 2
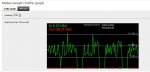
Good day. I was backing up my esxi server to nas using a NFS share. When copying files I noted that the line in the traffic graphic go down each 30 seconds. I don't know why.
The destination volume is a RAID5 made of 3 320GB Seagate Sata Drives. Maybe is it normal from a RAID5 to do that?
I have attached a traffic graph screenshot to show you what I am talking about.
Anyone know something that can cause this?
Thank
My FreeNAS:
0.7.2 Sabanda (revision 8191)
Intel Pentium Dual Core 2.9 Ghz
DDR2 800Mhz 2GB RAM
RAID5 Hard Drives:
3 Seagate ST3320418AS-CC37-305245MB
RAID1 Hard Drives:
1 WDC-WD10EAVS-32D7B1-01.01A01
1 Hitachi-HDT721010SLA360-ST6OA3AA
RAID5 Info:
Geom name: RAID5
State: COMPLETE HOT
Status: Total=3, Online=3
Type: AUTOMATIC
Stripesize: 131072
MemUse: 483328 (msl 43)
Newest: -1
ID: 2314258937
Providers:
1. Name: raid5/RAID5
Mediasize: 640145686528 (596G)
Sectorsize: 512
Mode: r1w1e2
Consumers:
1. Name: ad10
Mediasize: 320072933376 (298G)
Sectorsize: 512
Mode: r2w2e3
DiskNo: 2
Error: No
2. Name: ad8
Mediasize: 320072933376 (298G)
Sectorsize: 512
Mode: r2w2e3
DiskNo: 1
Error: No
3. Name: ad6
Mediasize: 320072933376 (298G)
Sectorsize: 512
Mode: r2w2e3
DiskNo: 0
Error: No