Strange Performance Graphs

Status
Not open for further replies.

MAHDTech

Cadet
Joined
May 29, 2013
Messages
8
Hi,

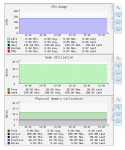
I am getting some strange numbers in the Reporting Graphs

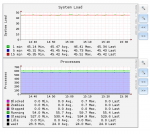
system load reports as 45.14,45.31,45.35

CPU chart also always shows the same numbers, never changes


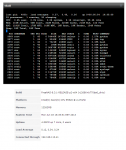
yet if I look at top, or the system info the load is very small and seems more accurate

How can I fix these graphs?
FreeNAS 1.png

FreeNAS 2.png

FreeNAS 3.png
 

jgreco

Resident Grinch
Joined
May 29, 2011
Messages
18,680
That's a LOT of processes showing active, and only updated at 15:30. Your top display shows the time as 16:35 and freshly rebooted. Were you having some problems that caused you to reboot?
 

MAHDTech

Cadet
Joined
May 29, 2013
Messages
8
I rebooted to see if the graphs would change to lower utilization

made no difference.

according to top the CPU is idle yet the graphs report high load, are the graphs reporting incorrectly?

- - - Updated - - -

hrm

rebooted again today, and the graphs now shows the same as what top does

FreeNAS NEW.png

- - - Updated - - -

This shows when I rebooted again, the load dropped

FreeNAS Zoomed.png
 
Status
Not open for further replies.
Top