14. Reporting
Reporting displays several graphs, as seen in the example in Figure 14.1. Click the tab for a device type to see its graphs.
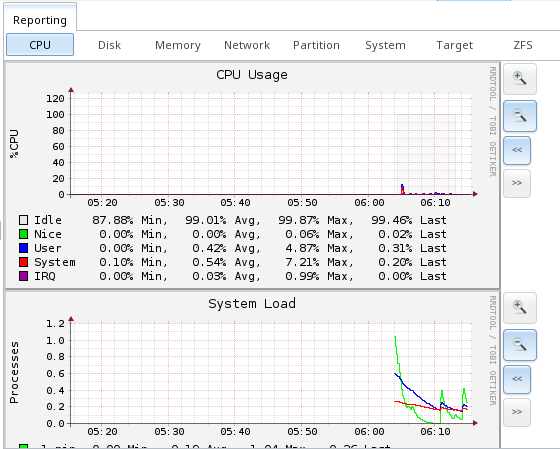
Fig. 14.1 Reporting Graphs
FreeNAS® uses
collectd
to provide reporting statistics. collectd plugins are enabled in
/conf/base/etc/local/collectd.conf to provide reporting
graphs. These graphs are grouped into several tabs on the Reporting
page:
- CPU
- CPU shows the amount of time spent by the CPU in various states such as executing user code, executing system code, and being idle.
- Disk
- Disk shows statistics on I/O, percent busy, latency, operations per second, and pending I/O requests.
- Memory
- Network
- Interface shows received and transmitted traffic in bits per second for each configured interface.
- Partition
- Disk space displays free and used space for each volume and dataset. However, the disk space used by an individual zvol is not displayed as it is a block device.
- System
- Processes and Uptime displays the number of processes, grouped by state.
- Uptime keeps track of the system uptime, the average running time, and the maximum reached uptime.
- Target
- Target shows bandwidth statistics for iSCSI ports.
- ZFS
- ZFS shows ARC size, hit ratio, and requests.
Reporting data is saved, making it possible to view and monitor usage
trends over time. By default, reporting data is saved to
/data/rrd_dir.tar.bz2 and is preserved across system
upgrades and at shutdown. To instead save this data to the system
dataset, check the Reporting database box in
System → System Dataset.
Use the magnifier buttons next to each graph to increase or decrease the displayed time increment from 10 minutes, hourly, daily, weekly, or monthly. The << and >> buttons can be used to scroll through the output.
Update on using Graphite with FreeNAS contains instructions for sending the collected information to a Graphite server.