Volume Status UNKNOWN

Status
Not open for further replies.

nogi

Explorer
Joined
Jul 5, 2011
Messages
74
My FreeNAS:
  • HP Microserver N54L
  • 16GB Kingston ECC RAM
  • 4 x Hitachi 7K3000 SATA HDDs
  • FreeNAS-8.3.1-RELEASE-p2-x64 (r12686+b770da6_dirty)
Error:
  • WARNING: The volume KDATA (ZFS) status is UNKNOWN: One or more devices has experienced an error resulting in data corruption. Applications may be affected.Restore the file in question if possible. Otherwise restore the entire pool from backup.
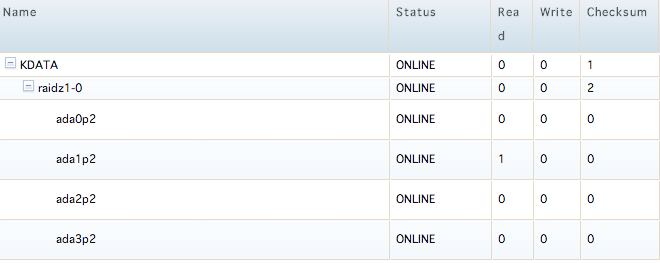
The volume is showing as HEALTHY in View Volumes, but when I click on Volume Status I see as attached. I've just replaced ada2p2, are my other drives failing too?
FreeNAS Error.png
 

William Grzybowski

Wizard
iXsystems
Joined
May 27, 2011
Messages
1,754
Maybe, sounds like bitrot and/or some defective hardware. It could be disks, cable or controller, in that order.

Check SMART info for the disks (smartctl -a /dev/adaX).

Also make sure to run zpool scrub as it can detect corruption and prevent data loss.
 

nogi

Explorer
Joined
Jul 5, 2011
Messages
74
It's definately not the controller or cable, I moved the HDDs from one microserver to another and have the same result. Looking like the disk?

I'm not sure what bitrot is, will look it up. This is what I get for ada1:

Code:
[root@Krypton] ~# smartctl -a /dev/ada1
smartctl 5.43 2012-06-30 r3573 [FreeBSD 8.3-RELEASE-p7 amd64] (local build)
Copyright (C) 2002-12 by Bruce Allen, http://smartmontools.sourceforge.net
 
=== START OF INFORMATION SECTION ===
Device Model:    Hitachi HDS723030BLE640
Serial Number:    MS79215X******
LU WWN Device Id: 5 000cca 37ec13efd
Firmware Version: MX6OAAB0
User Capacity:    3,000,592,982,016 bytes [3.00 TB]
Sector Sizes:    512 bytes logical, 4096 bytes physical
Device is:        Not in smartctl database [for details use: -P showall]
ATA Version is:  8
ATA Standard is:  ATA-8-ACS revision 4
Local Time is:    Mon Jun 10 11:42:16 2013 EST
SMART support is: Available - device has SMART capability.
SMART support is: Enabled
 
=== START OF READ SMART DATA SECTION ===
SMART overall-health self-assessment test result: PASSED
 
General SMART Values:
Offline data collection status:  (0x84)Offline data collection activity
was suspended by an interrupting command from host.
Auto Offline Data Collection: Enabled.
Self-test execution status:      (  0)The previous self-test routine completed
without error or no self-test has ever
been run.
Total time to complete Offline
data collection:(23513) seconds.
Offline data collection
capabilities:(0x5b) SMART execute Offline immediate.
Auto Offline data collection on/off support.
Suspend Offline collection upon new
command.
Offline surface scan supported.
Self-test supported.
No Conveyance Self-test supported.
Selective Self-test supported.
SMART capabilities:            (0x0003)Saves SMART data before entering
power-saving mode.
Supports SMART auto save timer.
Error logging capability:        (0x01)Error logging supported.
General Purpose Logging supported.
Short self-test routine
recommended polling time:(  1) minutes.
Extended self-test routine
recommended polling time:( 392) minutes.
SCT capabilities:      (0x003d)SCT Status supported.
SCT Error Recovery Control supported.
SCT Feature Control supported.
SCT Data Table supported.
 
SMART Attributes Data Structure revision number: 16
Vendor Specific SMART Attributes with Thresholds:
ID# ATTRIBUTE_NAME          FLAG    VALUE WORST THRESH TYPE      UPDATED  WHEN_FAILED RAW_VALUE
  1 Raw_Read_Error_Rate    0x000b  100  100  016    Pre-fail  Always      -      0
  2 Throughput_Performance  0x0005  140  140  054    Pre-fail  Offline      -      69
  3 Spin_Up_Time            0x0007  138  138  024    Pre-fail  Always      -      410 (Average 420)
  4 Start_Stop_Count        0x0012  100  100  000    Old_age  Always      -      178
  5 Reallocated_Sector_Ct  0x0033  100  100  005    Pre-fail  Always      -      0
  7 Seek_Error_Rate        0x000b  100  100  067    Pre-fail  Always      -      0
  8 Seek_Time_Performance  0x0005  124  124  020    Pre-fail  Offline      -      33
  9 Power_On_Hours          0x0012  100  100  000    Old_age  Always      -      3470
10 Spin_Retry_Count        0x0013  100  100  060    Pre-fail  Always      -      0
12 Power_Cycle_Count      0x0032  100  100  000    Old_age  Always      -      10
192 Power-Off_Retract_Count 0x0032  100  100  000    Old_age  Always      -      247
193 Load_Cycle_Count        0x0012  100  100  000    Old_age  Always      -      247
194 Temperature_Celsius    0x0002  200  200  000    Old_age  Always      -      30 (Min/Max 24/47)
196 Reallocated_Event_Count 0x0032  100  100  000    Old_age  Always      -      0
197 Current_Pending_Sector  0x0022  100  100  000    Old_age  Always      -      8
198 Offline_Uncorrectable  0x0008  100  100  000    Old_age  Offline      -      0
199 UDMA_CRC_Error_Count    0x000a  200  200  000    Old_age  Always      -      0
 
SMART Error Log Version: 1
ATA Error Count: 40 (device log contains only the most recent five errors)
CR = Command Register [HEX]
FR = Features Register [HEX]
SC = Sector Count Register [HEX]
SN = Sector Number Register [HEX]
CL = Cylinder Low Register [HEX]
CH = Cylinder High Register [HEX]
DH = Device/Head Register [HEX]
DC = Device Command Register [HEX]
ER = Error register [HEX]
ST = Status register [HEX]
Powered_Up_Time is measured from power on, and printed as
DDd+hh:mm:SS.sss where DD=days, hh=hours, mm=minutes,
SS=sec, and sss=millisec. It "wraps" after 49.710 days.
 
Error 40 occurred at disk power-on lifetime: 3422 hours (142 days + 14 hours)
  When the command that caused the error occurred, the device was active or idle.
 
  After command completion occurred, registers were:
  ER ST SC SN CL CH DH
  -- -- -- -- -- -- --
  40 51 21 40 b4 41 0c  Error: WP at LBA = 0x0c41b440 = 205632576
 
  Commands leading to the command that caused the error were:
  CR FR SC SN CL CH DH DC  Powered_Up_Time  Command/Feature_Name
  -- -- -- -- -- -- -- --  ----------------  --------------------
  61 56 40 b6 b3 41 40 00      02:27:57.769  WRITE FPDMA QUEUED
  60 55 38 0c b4 41 40 00      02:27:57.769  READ FPDMA QUEUED
  2f 00 01 10 00 00 00 00      02:27:57.769  READ LOG EXT
  61 56 38 b6 b3 41 40 00      02:27:54.483  WRITE FPDMA QUEUED
  60 55 30 0c b4 41 40 00      02:27:54.483  READ FPDMA QUEUED
 
Error 39 occurred at disk power-on lifetime: 3422 hours (142 days + 14 hours)
  When the command that caused the error occurred, the device was active or idle.
 
  After command completion occurred, registers were:
  ER ST SC SN CL CH DH
  -- -- -- -- -- -- --
  40 51 21 40 b4 41 0c  Error: WP at LBA = 0x0c41b440 = 205632576
 
  Commands leading to the command that caused the error were:
  CR FR SC SN CL CH DH DC  Powered_Up_Time  Command/Feature_Name
  -- -- -- -- -- -- -- --  ----------------  --------------------
  61 56 38 b6 b3 41 40 00      02:27:54.483  WRITE FPDMA QUEUED
  60 55 30 0c b4 41 40 00      02:27:54.483  READ FPDMA QUEUED
  2f 00 01 10 00 00 00 00      02:27:54.482  READ LOG EXT
  61 56 30 b6 b3 41 40 00      02:27:51.030  WRITE FPDMA QUEUED
  60 55 28 0c b4 41 40 00      02:27:51.030  READ FPDMA QUEUED
 
Error 38 occurred at disk power-on lifetime: 3422 hours (142 days + 14 hours)
  When the command that caused the error occurred, the device was active or idle.
 
  After command completion occurred, registers were:
  ER ST SC SN CL CH DH
  -- -- -- -- -- -- --
  40 51 21 40 b4 41 0c  Error: WP at LBA = 0x0c41b440 = 205632576
 
  Commands leading to the command that caused the error were:
  CR FR SC SN CL CH DH DC  Powered_Up_Time  Command/Feature_Name
  -- -- -- -- -- -- -- --  ----------------  --------------------
  61 56 30 b6 b3 41 40 00      02:27:51.030  WRITE FPDMA QUEUED
  60 55 28 0c b4 41 40 00      02:27:51.030  READ FPDMA QUEUED
  2f 00 01 10 00 00 00 00      02:27:51.030  READ LOG EXT
  61 56 28 b6 b3 41 40 00      02:27:47.610  WRITE FPDMA QUEUED
  60 55 20 0c b4 41 40 00      02:27:47.610  READ FPDMA QUEUED
 
Error 37 occurred at disk power-on lifetime: 3422 hours (142 days + 14 hours)
  When the command that caused the error occurred, the device was active or idle.
 
  After command completion occurred, registers were:
  ER ST SC SN CL CH DH
  -- -- -- -- -- -- --
  40 51 21 40 b4 41 0c  Error: WP at LBA = 0x0c41b440 = 205632576
 
  Commands leading to the command that caused the error were:
  CR FR SC SN CL CH DH DC  Powered_Up_Time  Command/Feature_Name
  -- -- -- -- -- -- -- --  ----------------  --------------------
  61 56 28 b6 b3 41 40 00      02:27:47.610  WRITE FPDMA QUEUED
  60 55 20 0c b4 41 40 00      02:27:47.610  READ FPDMA QUEUED
  2f 00 01 10 00 00 00 00      02:27:47.610  READ LOG EXT
  61 56 20 b6 b3 41 40 00      02:27:44.299  WRITE FPDMA QUEUED
  60 55 18 0c b4 41 40 00      02:27:44.299  READ FPDMA QUEUED
 
Error 36 occurred at disk power-on lifetime: 3422 hours (142 days + 14 hours)
  When the command that caused the error occurred, the device was active or idle.
 
  After command completion occurred, registers were:
  ER ST SC SN CL CH DH
  -- -- -- -- -- -- --
  40 51 21 40 b4 41 0c  Error: WP at LBA = 0x0c41b440 = 205632576
 
  Commands leading to the command that caused the error were:
  CR FR SC SN CL CH DH DC  Powered_Up_Time  Command/Feature_Name
  -- -- -- -- -- -- -- --  ----------------  --------------------
  61 56 20 b6 b3 41 40 00      02:27:44.299  WRITE FPDMA QUEUED
  60 55 18 0c b4 41 40 00      02:27:44.299  READ FPDMA QUEUED
  61 10 18 90 02 40 40 00      02:27:44.286  WRITE FPDMA QUEUED
  61 10 18 90 a0 50 40 00      02:27:44.259  WRITE FPDMA QUEUED
  61 10 18 90 9e 50 40 00      02:27:44.256  WRITE FPDMA QUEUED
 
SMART Self-test log structure revision number 1
No self-tests have been logged.  [To run self-tests, use: smartctl -t]
 
 
SMART Selective self-test log data structure revision number 1
SPAN  MIN_LBA  MAX_LBA  CURRENT_TEST_STATUS
    1        0        0  Not_testing
    2        0        0  Not_testing
    3        0        0  Not_testing
    4        0        0  Not_testing
    5        0        0  Not_testing
Selective self-test flags (0x0):
  After scanning selected spans, do NOT read-scan remainder of disk.
If Selective self-test is pending on power-up, resume after 0 minute delay.
 

William Grzybowski

Wizard
iXsystems
Joined
May 27, 2011
Messages
1,754
Yes, it does not look so good.

It has a few pending sectors and a few errors logged. Bet way of course would be replace it as you have only one disk for parity. Disks like this tend to increase the sectors errors as time passes and delay reads with retrials.
 

nogi

Explorer
Joined
Jul 5, 2011
Messages
74
ADA0 and ADA2 (replaced last week) tested with 0 errors. This drive and ADA3 are showing similar errors. Hmmmm might pick up 2 drives this week. How do I know if ADA2 has finished it's syncing (or whatever it's called with ZFS)? I don't want to drop another drive if the array hasn't rebuilt from the previous replacement.
 

William Grzybowski

Wizard
iXsystems
Joined
May 27, 2011
Messages
1,754
Check "zpool status" from CLI, it should have more complete info, also make sure to run zpool scrub once again before replace just to be sure everything is in place.
 

nogi

Explorer
Joined
Jul 5, 2011
Messages
74
I've done the scrub a couple of times already as well

Code:
[root@Krypton] ~# zpool status
  pool: KDATA
state: ONLINE
status: One or more devices has experienced an error resulting in data
    corruption.  Applications may be affected.
action: Restore the file in question if possible.  Otherwise restore the
    entire pool from backup.
  see: http://www.sun.com/msg/ZFS-8000-8A
  scan: scrub repaired 43K in 7h56m with 1 errors on Sat Jun  8 17:40:55 2013
config:
 
    NAME                                            STATE    READ WRITE CKSUM
    KDATA                                          ONLINE      0    0    1
      raidz1-0                                      ONLINE      0    0    2
        gptid/6bbf1ab9-03b2-11e1-86ca-0024817d3e5a  ONLINE      0    0    0
        gptid/bd980f2c-561b-11e2-93ac-0024817d3e5a  ONLINE      1    0    0
        gptid/85a0b887-cd15-11e2-b576-0024817d3e5a  ONLINE      0    0    0
        gptid/6e7e3ac0-03b2-11e1-86ca-0024817d3e5a  ONLINE      0    0    0
 
errors: 1 data errors, use '-v' for a list
 

William Grzybowski

Wizard
iXsystems
Joined
May 27, 2011
Messages
1,754
Ok, seems like still one file corrupted in the process, use zpool status -v to check which one. Use zpool clear KDATA as well to clear error counts.
 
Status
Not open for further replies.
Top