Very High CPU after 9.2.1.7 upgrade

Status
Not open for further replies.

antivirus

Dabbler
Joined
Jun 19, 2014
Messages
24
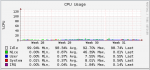
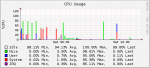
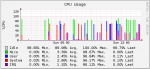
Did the upgrade to 9.2.1.7 via the webui on my box on Tuesday early morning. Specs for the server are : Supermicro mobo with dual Xeon L5520 and 96GB of RAM. I'm running two jails, one for Plex and one for PlexWatch. After the upgrade I've noticed some very high CPU usage under the reporting section. I've looked on my plex setup and there has not been any abnormal usage or transcoding. Looking at the graph it seems that the update is likely to blame. Any debugging tips or should I roll back to 9.2.1.6 (and what is the best route)?

I've attached a graph of the recent high CPU as well as a graph of the normal CPU for comparing purpose.
 

Attachments

  • normal CPU.png
    normal CPU.png
    23.4 KB · Views: 324
  • high CPU.png
    high CPU.png
    26.5 KB · Views: 327

DrKK

FreeNAS Generalissimo
Joined
Oct 15, 2013
Messages
3,630
Well I'll bring up two things.

First of all, why not turn off the plex jails temporarily (you can "stop" jails in the GUI), and see if this has any effect on the CPU usage? If your hypothesis is right, it shouldn't have any effect.

Second of all, I, too, did notice a change in CPU behavior when I went to 9.2.1.7. Now, mine was less dramatic---when I'm idle, I'm still idle. It's not like I went from nearly 0% CPU to always significantly non-zero CPU like you did, but, I did notice that the CX states on the CPU stay in a higher power state 2-3 times more than before I went to 9.2.1.7. (whoopdie doo---probably added 0.5W to my total power use---but still, something is different).

But before we blame the upgrade, let's rule out Plex. If there are 100 things that could be "Plex, or FreeNAS", experience shows that at least 98 of them will turn out to be Plex.
 

Ericloewe

Server Wrangler
Moderator
Joined
Feb 15, 2014
Messages
20,194
There's also been talk that Plex has been acting weird recently, so all the more reasons to remove it from the equation.
 

antivirus

Dabbler
Joined
Jun 19, 2014
Messages
24
Thanks for the tips. Just shut off both of the jails (plex, plexWatch) and will report back with the results shortly. If its a plex related issue I wonder what in the 9.2.1.7 update caused it to start eating up CPU.
 

antivirus

Dabbler
Joined
Jun 19, 2014
Messages
24
So it looks like the problem isn't plex related. I turned the jails off at the same time I posted yesterday. The rest of the day it looked like things were going well but looking at todays chart there are still abnormally high CPU spikes. Any thoughts on how to debug further? I wouldn't mind rolling back to 9.2.1.6. Should I just reboot the box and select the second boot option?
 

Attachments

  • sat.png
    sat.png
    24.4 KB · Views: 297
  • sunday.png
    sunday.png
    25 KB · Views: 309
  • past week.png
    past week.png
    27.9 KB · Views: 304
Last edited:

cyberjock

Inactive Account
Joined
Mar 25, 2012
Messages
19,526
What you need to do is start looking in "top" when your system loading is going really high and see what it's actually doing. ;)
 

antivirus

Dabbler
Joined
Jun 19, 2014
Messages
24
What you need to do is start looking in "top" when your system loading is going really high and see what it's actually doing. ;)

Tried to setup top to write output to a file overnight (so I could then cross reference high CPU times with the log) but can't seem to get the command correct. I SSH'd into my box and used tmux to open a new session. Planned on running the following command all night but the code doesn't seem to be working correctly.
Code:
top -b -d 10 >> /mnt/main/file.txt


It'll usually exit within a few iterations. I tried different permutations of the flags as well as adding "-n 100" to no avail.
 
Last edited:

philiplu

Explorer
Joined
Aug 10, 2014
Messages
58
Planned on running the following command all night but the code doesn't seem to be working correctly.
Code:
top -b -d 10 >> /mnt/main/file.txt

The "-d 10" instructs top to output 10 times (at the default 2 second intervals), then quit. You want something like this instead:

Code:
top -b -d all -s 10 -S >> /mnt/main/file.txt


That'll keep running until you kill it, reporting every ten seconds instead of 2, and include system processes like the kernel, in case that's where the high CPU usage is located.
 

antivirus

Dabbler
Joined
Jun 19, 2014
Messages
24
Thanks for the help philliplu! I was under the impression that the "-d x" flag instructed it to delay x amount of seconds between updates. Any chance you could link to documentation of the top command that you used? The ones I found didn't provide good explanation. I'll leave the command running and report back on my findings soon.
 
Last edited:

philiplu

Explorer
Joined
Aug 10, 2014
Messages
58
Last edited:

antivirus

Dabbler
Joined
Jun 19, 2014
Messages
24
Ok, so after going through the top log (outputted ever 2 seconds) overnight I cannot seem to correlate the graph spikes under the reporting tab with the top log. For example, if the graph shows a spike at 5:30 am the top logs show idle the entire time instead of the high usage the graph reports. Any way to only output top if the CPU usage is over a certain threshold? or maybe use grep to achieve this?
 
Last edited:
Status
Not open for further replies.
Top