Unexplainable disk I/O

Status
Not open for further replies.

Egon Olieux

Dabbler
Joined
Oct 7, 2014
Messages
20
Hi all,

My FreeNAS server (version 9.3-STABLE-201502271818) has 2 zpools, one for storage containing a mirror (zpool0) and one containing a single SSD (zpool1) for jails and the system dataset.

Recently I noticed disk I/O to zpool1 (the SSD) is abnormally high, averaging around 500kB/s write and 200kB/s read. My first thought was that the system dataset might be the cause (collectd and syslog), but after moving it to zpool0, the disk writes only dropped by +- 150kB/s. The FreeNAS reports, iostat, zpool iostat and smartctl (LBA written) all seem to report the same numbers.

ada0 (SSD):

upload_2015-3-4_20-50-59.png


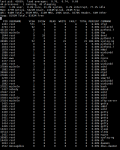
I've been trying to find the cause of this high I/O (particularly the writes, since it will degrade my SSD lifespan) without any success. Top seems to report idle writes for all processes (except for collectd). To further narrow down the problem, I individually stopped all active jails, but the I/O remains unchanged.

Top I/O stats:

upload_2015-3-4_21-10-50.png


Other details which might help:

Installed jails (& plugins):
- Subsonic
- Plexmediaserver
- Transmission
- Firefly
- Xonarr
- Owncloud
- BTSync
- Nginx (as reverse proxy for SSL)

System specs:
- CPU: Xeon E3-1220
- RAM: 16GB ECC
- Mobo: AsRock Rack E3C226D2I
- Samsung 840 Evo 120GB
- Western Digital Red 4TB (2x)

Thanks in advance.
 
Last edited:

cyberjock

Inactive Account
Joined
Mar 25, 2012
Messages
19,526
"top -m io" will tell you exactly what process is trigger I/O.
 

Egon Olieux

Dabbler
Joined
Oct 7, 2014
Messages
20
"top -m io" will tell you exactly what process is trigger I/O.
I already posted the output from 'top -m io' in my start post and everything seems idle except for collectd which spikes every 15 seconds or so.
Iostat seems to reports an 'unexplainable' constant write of +- 500kBps (451.6 at time of screen) in between the collectd spikes.
Thats the weird part; multiple sources indicate the write is happening, but no process(es) are indicating any disk I/O.
 

cyberjock

Inactive Account
Joined
Mar 25, 2012
Messages
19,526
Any reason you aren't looking at "zpool iostat 1"?

I'm confused on why you think 500KB/sec is being written every second, even when you looked at top -m io. The output of iostat -x is an average of extended statistics. If you read 4TB of data over 8 hours, then stop for 12 hours, you're going to see a very high read rate even if it's been 0bytes/sec for hours.

If you want second-for-second stats you should do iostat -x 1. Of course, that's only per-device. A better way to look at real-world writes from ZFS is zpool iostat 1. You can even break it down to "per device" with "zpool iostat -v <pool> 1".

I think you are taking that extended statistic, somehow deciding that that extended statistic is telling you that every second, even right this second, that much data is being written and read, then when you find nothing in top (because everything *really* is quiet right now, but was doing 500KB/sec statistically averaged over the previous (whatever timeframe iostat uses) and you are jumping to very wrong conclusions.
 

lonnie776

Cadet
Joined
Jul 16, 2012
Messages
9
I seem to be having a similar issue as stated above. Disk activity that I cannot track down. This has happened to me before and if I remember correctly the IO seems to stop after letting it do it's thing for a week or so. The problem I have with this is that the IO is on my Volume that I use for VM's. When the IO starts, it slows my VM's to a crawl.

I am running 8 2TB WD RE4 / WD SE in 2 mirror 4 span configuration.

Top -m io Output:
upload_2016-7-25_12-34-10.png


gstat Output:
upload_2016-7-25_12-39-42.png


Disks on my VM Volume are da6 - da12 and da14

I have tried searching all around the internet for this issue and this is the only thread I can find that looks similar to my issue.
I hope someone can help me with this.

Thanks
Lonnie

Edit: I am running build FreeNAS-9.10-STABLE-201605021851 (35c85f7)
 

HoneyBadger

actually does care
Administrator
Moderator
iXsystems
Joined
Feb 6, 2014
Messages
5,112
I seem to be having a similar issue as stated above. Disk activity that I cannot track down. This has happened to me before and if I remember correctly the IO seems to stop after letting it do it's thing for a week or so. The problem I have with this is that the IO is on my Volume that I use for VM's. When the IO starts, it slows my VM's to a crawl.

Obvious question: Does your scrub schedule line up with the heavy disk activity?
 

lonnie776

Cadet
Joined
Jul 16, 2012
Messages
9
Nope, no scrubs scheduled or in progress. Unfortunately whatever it was doing is now complete, so its kinds hard to troubleshoot now. I will probably re-post here if it comes up again.

Thank you.
 

lonnie776

Cadet
Joined
Jul 16, 2012
Messages
9
It started up again.

This is really starting to irritate me as it seemingly completely saturates the IO of the vdev with hundreds of tiny writes.
Exact same story as last time.
gstat output:
upload_2016-8-3_16-4-51.png

Top -m io Output:
upload_2016-8-3_16-5-51.png


Does anyone have any ideas?
 

daktari

Cadet
Joined
Sep 23, 2016
Messages
3
Hi guys, i'm in the same situation...
I use my Freenas only to store my photos, but it's very slow because a extremely high read I/O activity

this is the iostat -x output:

2016-09-23_18-42-22.png
 
Status
Not open for further replies.
Top