seanmcg182
Dabbler
- Joined
- Feb 14, 2021
- Messages
- 18
To start, my system:
AsRock B450M Pro 4 Motherboard
AMD Ryzen 2700X CPU
32GB 3200MHz RAM
LSI SAS 9210 IT-Mode (Passed Through to TrueNAS)
3x8TB Toshiba X300 HDDs (Connected to SAS Card)
256GB HP EX920 NVMe SSD
Metal OS:
ESXi v6.7.0 Update 3
Install ISO was modified to include functioning Realtek Drivers, and NVME Driver from 6.5.0 (6.7 did not support my NVME by default)
VMs: (All VM Boot Drives are on the 256GB NVME Drive)
TrueNAS - 4 CPU Cores - 16GB RAM
Linux - 4 CPU Cores - 2GB RAM - Running SABnzbd
Linux - 4 CPU Cores - 2GB RAM - Running qBittorrent
Linux - 2 CPU Cores - 1GB RAM - Running Sonarr
Linux - 2 CPU Cores - 1GB RAM - Running Radarr
Linux - 2 CPU Cores - 1GB RAM - Running Lidarr
Linux - 2 CPU Cores - 1GB RAM - Running Plex
Windows - 4 - CPU Cores - 4GB RAM - Used for Remote Desktop to control server while travelling for work.
Linux VMs:
Have NFSCommon installed
Have this in fstab:
TrueNAS:
TrueNAS-12.0-U2
3x8TB Drives in RAIDZ1 configuration.
The Pool currently has Encryption Enabled, Sync Disabled, Atime Off, Compression Level LZ4, ZFS Deduplication ON
On the Pool I have an SMB Share, and an NFS Share.
The NFS Share has Mapall User as Root, and Mapall Group as Wheel, and all of my VM 192.168 IP addresses.
I can successfully access the share on my VMs (With the exception described in the issue further below)
Two of the Hard Drives do show an intermittent Parameter 7 SMART failure, however, this has been confirmed to be a Firmware Bug, as the RAW Value is still showing 0. I've been in contact with Toshiba about it, and I am probably going to Replace the drives when I get back from my business trip... However again, I do not think that this is related.
The Parameter Value for both of the drives just slowly moves between 001 and 100, regardless of load.
Currently both drives are reading at 85+ out of 100, which is a good value, and the Failure flag states IN_THE_PAST.... and if I had to guess, within 48 hours, it'll cycle down to 1 and back up to 100 again.
Ouput of of of the drives for reference:
The ISSUE:
Occassionally (every 3-15 minutes), TrueNAS will Kinda half-ass respond. Settings won't update or save on the web GUI... But if I try reloading the Web GUI, I get a notification that TrueNAS is non responsive or something.
During this time if I try to do an SSH Command (If I already have an SSH Window Open) it will hang and just give me a blank line until TrueNAS Comes back up.
If I try to Open an SSH Connection, it just times out and doesn't connect.
ALL of my Linux VM's that have the NFS Share Mounted stop downloading and report something along the lines of this SAMPLE taken from DMESG:
TrueNAS Debug file if it helps:
https://drive.google.com/file/d/1_1fIuBnpCRP4jHI_E-ckKxnZDneFtsfC/view?usp=sharing
Sorry for infodump, but figured the more information, the better!
If anyone has any other tests they'd like me to run, just ask.
AsRock B450M Pro 4 Motherboard
AMD Ryzen 2700X CPU
32GB 3200MHz RAM
LSI SAS 9210 IT-Mode (Passed Through to TrueNAS)
3x8TB Toshiba X300 HDDs (Connected to SAS Card)
256GB HP EX920 NVMe SSD
Metal OS:
ESXi v6.7.0 Update 3
Install ISO was modified to include functioning Realtek Drivers, and NVME Driver from 6.5.0 (6.7 did not support my NVME by default)
VMs: (All VM Boot Drives are on the 256GB NVME Drive)
TrueNAS - 4 CPU Cores - 16GB RAM
Linux - 4 CPU Cores - 2GB RAM - Running SABnzbd
Linux - 4 CPU Cores - 2GB RAM - Running qBittorrent
Linux - 2 CPU Cores - 1GB RAM - Running Sonarr
Linux - 2 CPU Cores - 1GB RAM - Running Radarr
Linux - 2 CPU Cores - 1GB RAM - Running Lidarr
Linux - 2 CPU Cores - 1GB RAM - Running Plex
Windows - 4 - CPU Cores - 4GB RAM - Used for Remote Desktop to control server while travelling for work.
Linux VMs:
Have NFSCommon installed
Have this in fstab:
I got that line of settings from my friend who helped me setup the server.192.168.1.241:/mnt/RAID-Z-1/Media /mediaplex nfs auto,nofail,noatime,nolock,intr,tcp,actimeo=1800 0 0
TrueNAS:
TrueNAS-12.0-U2
3x8TB Drives in RAIDZ1 configuration.
truenas% zpool status
pool: RAID-Z-1
state: ONLINE
scan: scrub repaired 0B in 06:02:56 with 0 errors on Tue Feb 23 07:19:56 2021
config:
NAME STATE READ WRITE CKSUM
RAID-Z-1 ONLINE 0 0 0
raidz1-0 ONLINE 0 0 0
gptid/2a944cf6-63fa-11eb-8aac-000c29d59c77 ONLINE 0 0 0
gptid/2ea55fc0-63fa-11eb-8aac-000c29d59c77 ONLINE 0 0 0
gptid/302ca57e-63fa-11eb-8aac-000c29d59c77 ONLINE 0 0 0
errors: No known data errors
pool: boot-pool
state: ONLINE
scan: scrub repaired 0B in 00:00:02 with 0 errors on Fri Mar 12 03:45:02 2021
config:
NAME STATE READ WRITE CKSUM
boot-pool ONLINE 0 0 0
da0p2 ONLINE 0 0 0
errors: No known data errors
truenas% ifconfig
vmx0: flags=8843<UP,BROADCAST,RUNNING,SIMPLEX,MULTICAST> metric 0 mtu 1500
options=e403bb<RXCSUM,TXCSUM,VLAN_MTU,VLAN_HWTAGGING,JUMBO_MTU,VLAN_HWCSUM,TSO4,TSO6,VLAN_HWTSO,RXCSUM_IPV6,TXCSUM_IPV6>
ether 00:0c:29:69:08:7c
inet 192.168.1.241 netmask 0xffffff00 broadcast 192.168.1.255
media: Ethernet autoselect
status: active
nd6 options=9<PERFORMNUD,IFDISABLED>
lo0: flags=8049<UP,LOOPBACK,RUNNING,MULTICAST> metric 0 mtu 16384
options=680003<RXCSUM,TXCSUM,LINKSTATE,RXCSUM_IPV6,TXCSUM_IPV6>
inet6 ::1 prefixlen 128
inet6 fe80::1%lo0 prefixlen 64 scopeid 0x2
inet 127.0.0.1 netmask 0xff000000
groups: lo
nd6 options=21<PERFORMNUD,AUTO_LINKLOCAL>
pflog0: flags=0<> metric 0 mtu 33160
groups: pflog
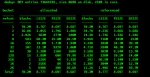
Not sure whatsup with my Alloc and Free, because my Pool size is 8.29TiB (59%) Used with 5.78TiB Free... I know, usage is getting a bit higher, but I don't think this is my issue, bear with me until the end.truenas% zpool iostat
capacity operations bandwidth
pool alloc free read write read write
---------- ----- ----- ----- ----- ----- -----
RAID-Z-1 12.4T 9.37T 122 262 4.80M 9.57M
boot-pool 1.16G 18.3G 0 0 2.65K 115
---------- ----- ----- ----- ----- ----- -----
The Pool currently has Encryption Enabled, Sync Disabled, Atime Off, Compression Level LZ4, ZFS Deduplication ON
On the Pool I have an SMB Share, and an NFS Share.
The NFS Share has Mapall User as Root, and Mapall Group as Wheel, and all of my VM 192.168 IP addresses.
I can successfully access the share on my VMs (With the exception described in the issue further below)
Two of the Hard Drives do show an intermittent Parameter 7 SMART failure, however, this has been confirmed to be a Firmware Bug, as the RAW Value is still showing 0. I've been in contact with Toshiba about it, and I am probably going to Replace the drives when I get back from my business trip... However again, I do not think that this is related.
The Parameter Value for both of the drives just slowly moves between 001 and 100, regardless of load.
Currently both drives are reading at 85+ out of 100, which is a good value, and the Failure flag states IN_THE_PAST.... and if I had to guess, within 48 hours, it'll cycle down to 1 and back up to 100 again.
Ouput of of of the drives for reference:
truenas% sudo smartctl -a /dev/da3
Password:
smartctl 7.1 2019-12-30 r5022 [FreeBSD 12.2-RELEASE-p3 amd64] (local build)
Copyright (C) 2002-19, Bruce Allen, Christian Franke, www.smartmontools.org
=== START OF INFORMATION SECTION ===
Device Model: TOSHIBA HDWR180
Serial Number: 8040A13HFBLG
LU WWN Device Id: 5 000039 a58c90823
Firmware Version: 0603
User Capacity: 8,001,563,222,016 bytes [8.00 TB]
Sector Sizes: 512 bytes logical, 4096 bytes physical
Rotation Rate: 7200 rpm
Form Factor: 3.5 inches
Device is: Not in smartctl database [for details use: -P showall]
ATA Version is: ACS-3 T13/2161-D revision 5
SATA Version is: SATA 3.3, 6.0 Gb/s (current: 6.0 Gb/s)
Local Time is: Thu Mar 18 11:43:54 2021 EDT
SMART support is: Available - device has SMART capability.
SMART support is: Enabled
=== START OF READ SMART DATA SECTION ===
SMART overall-health self-assessment test result: PASSED
See vendor-specific Attribute list for marginal Attributes.
General SMART Values:
Offline data collection status: (0x84) Offline data collection activity
was suspended by an interrupting command from host.
Auto Offline Data Collection: Enabled.
Self-test execution status: ( 73) The previous self-test completed having
a test element that failed and the test
element that failed is not known.
Total time to complete Offline
data collection: ( 120) seconds.
Offline data collection
capabilities: (0x5b) SMART execute Offline immediate.
Auto Offline data collection on/off support.
Suspend Offline collection upon new
command.
Offline surface scan supported.
Self-test supported.
No Conveyance Self-test supported.
Selective Self-test supported.
SMART capabilities: (0x0003) Saves SMART data before entering
power-saving mode.
Supports SMART auto save timer.
Error logging capability: (0x01) Error logging supported.
General Purpose Logging supported.
Short self-test routine
recommended polling time: ( 2) minutes.
Extended self-test routine
recommended polling time: ( 830) minutes.
SCT capabilities: (0x003d) SCT Status supported.
SCT Error Recovery Control supported.
SCT Feature Control supported.
SCT Data Table supported.
SMART Attributes Data Structure revision number: 16
Vendor Specific SMART Attributes with Thresholds:
ID# ATTRIBUTE_NAME FLAG VALUE WORST THRESH TYPE UPDATED WHEN_FAILED RAW_VALUE
1 Raw_Read_Error_Rate 0x000b 100 100 050 Pre-fail Always - 0
2 Throughput_Performance 0x0005 100 100 050 Pre-fail Offline - 0
3 Spin_Up_Time 0x0027 100 100 001 Pre-fail Always - 7717
4 Start_Stop_Count 0x0032 100 100 000 Old_age Always - 149
5 Reallocated_Sector_Ct 0x0033 100 100 050 Pre-fail Always - 0
7 Seek_Error_Rate 0x000b 088 001 050 Pre-fail Always In_the_past 0
8 Seek_Time_Performance 0x0005 100 100 050 Pre-fail Offline - 0
9 Power_On_Hours 0x0032 098 098 000 Old_age Always - 1117
10 Spin_Retry_Count 0x0033 100 100 030 Pre-fail Always - 0
12 Power_Cycle_Count 0x0032 100 100 000 Old_age Always - 43
191 G-Sense_Error_Rate 0x0032 100 100 000 Old_age Always - 0
192 Power-Off_Retract_Count 0x0032 100 100 000 Old_age Always - 36
193 Load_Cycle_Count 0x0032 100 100 000 Old_age Always - 149
194 Temperature_Celsius 0x0022 100 100 000 Old_age Always - 41 (Min/Max 22/54)
196 Reallocated_Event_Count 0x0032 100 100 000 Old_age Always - 0
197 Current_Pending_Sector 0x0032 100 100 000 Old_age Always - 0
198 Offline_Uncorrectable 0x0030 100 100 000 Old_age Offline - 0
199 UDMA_CRC_Error_Count 0x0032 200 200 000 Old_age Always - 0
220 Disk_Shift 0x0002 001 001 000 Old_age Always - 67436740
222 Loaded_Hours 0x0032 098 098 000 Old_age Always - 952
223 Load_Retry_Count 0x0032 100 100 000 Old_age Always - 0
224 Load_Friction 0x0022 100 100 000 Old_age Always - 0
226 Load-in_Time 0x0026 100 100 000 Old_age Always - 525
240 Head_Flying_Hours 0x0001 100 100 001 Pre-fail Offline - 0
SMART Error Log Version: 1
No Errors Logged
SMART Self-test log structure revision number 1
Num Test_Description Status Remaining LifeTime(hours) LBA_of_first_error
# 1 Short offline Completed: unknown failure 90% 499 0
# 2 Extended offline Completed: unknown failure 90% 436 0
# 3 Short offline Completed: unknown failure 90% 435 0
# 4 Short offline Completed: unknown failure 90% 435 0
# 5 Short offline Completed: unknown failure 60% 435 0
# 6 Short offline Completed: unknown failure 90% 434 0
# 7 Short offline Completed: unknown failure 90% 433 0
# 8 Short offline Completed: unknown failure 90% 433 0
# 9 Extended offline Completed without error 00% 143 -
#10 Short offline Completed without error 00% 19 -
SMART Selective self-test log data structure revision number 1
SPAN MIN_LBA MAX_LBA CURRENT_TEST_STATUS
1 0 0 Not_testing
2 0 0 Not_testing
3 0 0 Not_testing
4 0 0 Not_testing
5 0 0 Not_testing
Selective self-test flags (0x0):
After scanning selected spans, do NOT read-scan remainder of disk.
If Selective self-test is pending on power-up, resume after 0 minute delay.
The ISSUE:
Occassionally (every 3-15 minutes), TrueNAS will Kinda half-ass respond. Settings won't update or save on the web GUI... But if I try reloading the Web GUI, I get a notification that TrueNAS is non responsive or something.
During this time if I try to do an SSH Command (If I already have an SSH Window Open) it will hang and just give me a blank line until TrueNAS Comes back up.
If I try to Open an SSH Connection, it just times out and doesn't connect.
ALL of my Linux VM's that have the NFS Share Mounted stop downloading and report something along the lines of this SAMPLE taken from DMESG:
[82124.341719] rpc_check_timeout: 14 callbacks suppressed
[82124.341721] nfs: server 192.168.1.241 not responding, still trying
[82124.342003] nfs: server 192.168.1.241 not responding, still trying
[82124.342209] nfs: server 192.168.1.241 not responding, still trying
[82124.342376] nfs: server 192.168.1.241 not responding, still trying
[82124.342586] nfs: server 192.168.1.241 not responding, still trying
[82124.342842] nfs: server 192.168.1.241 not responding, still trying
[82124.343057] nfs: server 192.168.1.241 not responding, still trying
[82124.343236] nfs: server 192.168.1.241 not responding, still trying
[82194.158268] nfs: server 192.168.1.241 not responding, still trying
[82194.159231] nfs: server 192.168.1.241 not responding, still trying
[82194.159547] nfs: server 192.168.1.241 not responding, still trying
[82194.159810] nfs: server 192.168.1.241 not responding, still trying
[82194.160050] nfs: server 192.168.1.241 not responding, still trying
[82194.160093] nfs: server 192.168.1.241 not responding, still trying
[82194.162363] nfs: server 192.168.1.241 not responding, still trying
[82194.162636] nfs: server 192.168.1.241 not responding, still trying
[82194.162838] nfs: server 192.168.1.241 not responding, still trying
[82194.163054] nfs: server 192.168.1.241 not responding, still trying
[82194.565804] nfs: server 192.168.1.241 OK
[82194.565839] nfs: server 192.168.1.241 OK
[82194.565890] nfs: server 192.168.1.241 OK
[82194.565934] nfs: server 192.168.1.241 OK
[82194.565977] nfs: server 192.168.1.241 OK
[82194.676875] nfs: server 192.168.1.241 OK
[82194.676942] nfs: server 192.168.1.241 OK
[82194.676989] nfs: server 192.168.1.241 OK
[82194.677074] nfs: server 192.168.1.241 OK
[82194.677098] nfs: server 192.168.1.241 OK
[82477.600634] rpc_check_timeout: 855 callbacks suppressed
[82477.600637] nfs: server 192.168.1.241 not responding, still trying
[82477.600646] nfs: server 192.168.1.241 not responding, still trying
[82477.600649] nfs: server 192.168.1.241 not responding, still trying
[82477.600651] nfs: server 192.168.1.241 not responding, still trying
[82477.600653] nfs: server 192.168.1.241 not responding, still trying
[82477.600654] nfs: server 192.168.1.241 not responding, still trying
[82482.976660] nfs: server 192.168.1.241 not responding, still trying
[82492.448701] nfs: server 192.168.1.241 not responding, still trying
[82498.336995] nfs: server 192.168.1.241 not responding, still trying
[82498.337007] nfs: server 192.168.1.241 not responding, still trying
[82498.337009] nfs: server 192.168.1.241 not responding, still trying
[82498.337012] nfs: server 192.168.1.241 not responding, still trying
[82498.337014] nfs: server 192.168.1.241 not responding, still trying
[82498.337017] nfs: server 192.168.1.241 not responding, still trying
[82508.576980] nfs: server 192.168.1.241 not responding, still trying
[82508.576992] nfs: server 192.168.1.241 not responding, still trying
[82512.416902] nfs: server 192.168.1.241 not responding, still trying
[82518.817067] nfs: server 192.168.1.241 not responding, still trying
[82537.070934] nfs: server 192.168.1.241 not responding, still trying
[82537.071047] nfs: server 192.168.1.241 not responding, still trying
[82537.071074] nfs: server 192.168.1.241 not responding, still trying
[82537.071097] nfs: server 192.168.1.241 not responding, still trying
[82537.071122] nfs: server 192.168.1.241 not responding, still trying
[82537.071166] nfs: server 192.168.1.241 not responding, still trying
[82537.071322] nfs: server 192.168.1.241 not responding, still trying
[82537.071346] nfs: server 192.168.1.241 not responding, still trying
[82537.071347] nfs: server 192.168.1.241 not responding, still trying
[82537.071367] nfs: server 192.168.1.241 not responding, still trying
[82586.760305] call_decode: 1008 callbacks suppressed
[82586.760309] nfs: server 192.168.1.241 OK
[82586.760851] rpc_check_timeout: 6 callbacks suppressed
[82586.760852] nfs: server 192.168.1.241 not responding, still trying
[82586.761003] nfs: server 192.168.1.241 not responding, still trying
[82586.761058] nfs: server 192.168.1.241 not responding, still trying
[82586.761102] nfs: server 192.168.1.241 not responding, still trying
[82586.761104] nfs: server 192.168.1.241 OK
[82586.761156] nfs: server 192.168.1.241 not responding, still trying
[82586.761212] nfs: server 192.168.1.241 not responding, still trying
[82586.761295] nfs: server 192.168.1.241 not responding, still trying
[82586.761349] nfs: server 192.168.1.241 not responding, still trying
[82586.761353] nfs: server 192.168.1.241 OK
[82586.761480] nfs: server 192.168.1.241 not responding, still trying
[82586.761541] nfs: server 192.168.1.241 not responding, still trying
[82586.761546] nfs: server 192.168.1.241 OK
[82586.762623] nfs: server 192.168.1.241 OK
[82586.763058] nfs: server 192.168.1.241 OK
[82586.763199] nfs: server 192.168.1.241 OK
[82586.766013] nfs: server 192.168.1.241 OK
[82586.766914] nfs: server 192.168.1.241 OK
[82586.767514] nfs: server 192.168.1.241 OK
TrueNAS Debug file if it helps:
https://drive.google.com/file/d/1_1fIuBnpCRP4jHI_E-ckKxnZDneFtsfC/view?usp=sharing
Sorry for infodump, but figured the more information, the better!
If anyone has any other tests they'd like me to run, just ask.