Hello,
I have two volumes setup.
Volume1 consists of 8 300gb 15k SAS drives, a 240GB SSD read cache, and a mirrored 50GB OCW Mercury Elite ZIL. The performance of Volume 1 is great, I am seeing 96MB/s write speed from ESX 5 with NFS over a 1 gigabit connection and far greater locally:
/mnt/Volume2# dd if=/dev/zero of=/mnt/Volume1/testfile bs=2048k count=50k
51200+0 records in
51200+0 records out
107374182400 bytes transferred in 284.522614 secs (377383649 bytes/sec)
Volume2 is a pair of 3TB Segate Sata Drives with a 120GB read cache SSD. I am getting 4 to 7 MB/s write speeds on these drives from the same ESX hosts (3 different hosts) using the same network link and NFS. When doing a local DD test I am getting about 140MB/s through put. Using gstat during the NFS writes shows both disks averaging 96% Busy. During the local DD test it shows 100% Busy
local dd test:
dd if=/dev/zero of=/mnt/Volume2/testfile bs=2048k count=50k
51200+0 records in
51200+0 records out
107374182400 bytes transferred in 713.323764 secs (150526574 bytes/sec)
zpool iostat -v 1 during a local dd test
capacity operations bandwidth
pool used avail read write read write
---------- ----- ----- ----- ----- ----- -----
Volume1 1.63T 539G 3 12 509K 195K
raidz2 1.63T 539G 3 0 509K 0
da0p2 - - 0 0 20.9K 0
da1p2 - - 1 0 42.8K 0
da2p2 - - 2 0 64.2K 0
da3p2 - - 3 0 85.6K 0
da4p2 - - 3 0 85.6K 0
da5p2 - - 3 0 84.6K 0
da6p2 - - 3 0 84.1K 0
da7p2 - - 1 0 41.8K 0
mirror 8K 44.5G 0 12 0 195K
da10p2 - - 0 12 0 195K
da9p2 - - 0 12 0 195K
cache - - - - - -
da12p1 224G 8M 1 0 255K 0
---------- ----- ----- ----- ----- ----- -----
Volume2 209G 2.51T 0 1.18K 0 151M
mirror 209G 2.51T 0 1.18K 0 151M
da15p2 - - 0 1.22K 0 156M
da16p2 - - 0 1.19K 0 152M
cache - - - - - -
da13p1 119G 0 0 63 0 7.96M
---------- ----- ----- ----- ----- ----- -----
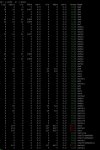
During nfs transfer this shows Volume2 getting 4M/s and gstat shows 96% busy on both disks. I've attached a screen capture of gstat during an nfs write
The local DD test shows results that I expected, but the NFS is extremely slow on writes. Read speed is fine
I have two volumes setup.
Volume1 consists of 8 300gb 15k SAS drives, a 240GB SSD read cache, and a mirrored 50GB OCW Mercury Elite ZIL. The performance of Volume 1 is great, I am seeing 96MB/s write speed from ESX 5 with NFS over a 1 gigabit connection and far greater locally:
/mnt/Volume2# dd if=/dev/zero of=/mnt/Volume1/testfile bs=2048k count=50k
51200+0 records in
51200+0 records out
107374182400 bytes transferred in 284.522614 secs (377383649 bytes/sec)
Volume2 is a pair of 3TB Segate Sata Drives with a 120GB read cache SSD. I am getting 4 to 7 MB/s write speeds on these drives from the same ESX hosts (3 different hosts) using the same network link and NFS. When doing a local DD test I am getting about 140MB/s through put. Using gstat during the NFS writes shows both disks averaging 96% Busy. During the local DD test it shows 100% Busy
local dd test:
dd if=/dev/zero of=/mnt/Volume2/testfile bs=2048k count=50k
51200+0 records in
51200+0 records out
107374182400 bytes transferred in 713.323764 secs (150526574 bytes/sec)
zpool iostat -v 1 during a local dd test
capacity operations bandwidth
pool used avail read write read write
---------- ----- ----- ----- ----- ----- -----
Volume1 1.63T 539G 3 12 509K 195K
raidz2 1.63T 539G 3 0 509K 0
da0p2 - - 0 0 20.9K 0
da1p2 - - 1 0 42.8K 0
da2p2 - - 2 0 64.2K 0
da3p2 - - 3 0 85.6K 0
da4p2 - - 3 0 85.6K 0
da5p2 - - 3 0 84.6K 0
da6p2 - - 3 0 84.1K 0
da7p2 - - 1 0 41.8K 0
mirror 8K 44.5G 0 12 0 195K
da10p2 - - 0 12 0 195K
da9p2 - - 0 12 0 195K
cache - - - - - -
da12p1 224G 8M 1 0 255K 0
---------- ----- ----- ----- ----- ----- -----
Volume2 209G 2.51T 0 1.18K 0 151M
mirror 209G 2.51T 0 1.18K 0 151M
da15p2 - - 0 1.22K 0 156M
da16p2 - - 0 1.19K 0 152M
cache - - - - - -
da13p1 119G 0 0 63 0 7.96M
---------- ----- ----- ----- ----- ----- -----
During nfs transfer this shows Volume2 getting 4M/s and gstat shows 96% busy on both disks. I've attached a screen capture of gstat during an nfs write
The local DD test shows results that I expected, but the NFS is extremely slow on writes. Read speed is fine