Reporting graphs missing

Status
Not open for further replies.

Jim Streit

Cadet
Joined
Jan 10, 2017
Messages
8
Hello,
After applying the latest round of updates my reporting graphs are not working. This is happening with all of the reporting graphs. The graphs used to work, is there anything I can do to fix this?

FreeNAS-9.10.2-U1 (86c7ef5)

HP Proliant Microserver N40L
AMD Turion(tm) II Neo N40L Dual-Core Processor
8 GB ECC Ram
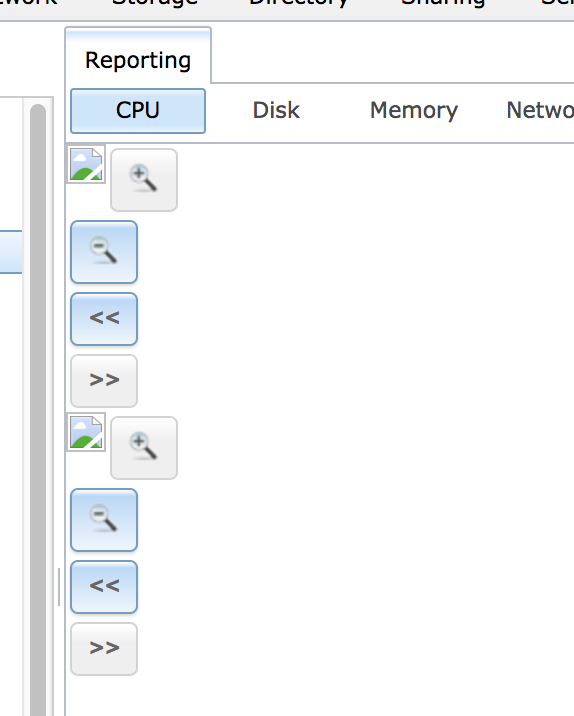
upload_2017-1-26_23-18-44.png


Thank you.
 

SweetAndLow

Sweet'NASty
Joined
Nov 6, 2013
Messages
6,421
Verify your install and refresh the page. Maybe for boot device is going bad?

Sent from my Nexus 5X using Tapatalk
 

Jim Streit

Cadet
Joined
Jan 10, 2017
Messages
8
SweetAndLow,
Thanks for the quick reply.
One thing that I just noticed is that I've started to get an error that repeats on the screen.

freenas collectd[4263]: check_create_dir: 'var/db/collected/rrd/freenas.domain.local' exists but is not a directory

If I check that location I see freenas.domain.local@ -> localhost

It's not a directory and I can't open it. I deleted it and FreeNAS automatically created a directory with the same name and about 26 sub directories with names for each of my drives, cpu, volumes etc ...
Inside each of those subdirectories there are files that end .rrd

If I reboot the box the error message comes right back and the same thing.

I booted to the initial-install image and the graphs work but of course none of my settings or volumes exist.

Thouhgts???
Thank you.
 

Jim Streit

Cadet
Joined
Jan 10, 2017
Messages
8
OK, looks like I fixed it. This fix has survived a couple of reboots and the graphs are working again. All new data but thats perfectly fine.

I found this bug posting.
https://bugs.freenas.org/issues/18824

I'm not sure why the "localhost" folder was missing, but I created the "localhost" folder manually and then rebooted. (rebooted a couple more times just to see if the localhost folder stays, and it did)

[root@freenas] /var/db/collectd/rrd# ls -l
total 5
drwxr-xr-x 3 root wheel 4 Jan 27 00:42 ./
drwxr-xr-x 7 root wheel 9 Jan 26 22:47 ../
lrwxr-xr-x 1 root wheel 9 Jan 27 00:42 freenas.domain.local@ -> localhost
drwxr-xr-x 28 root wheel 28 Jan 27 00:43 localhost/
[root@freenas] /var/db/collectd/rrd#

Thanks.
 

melloa

Wizard
Joined
May 22, 2016
Messages
1,749
OK, looks like I fixed it. This fix has survived a couple of reboots and the graphs are working again. All new data but thats perfectly fine.

I found this bug posting.
https://bugs.freenas.org/issues/18824

I'm not sure why the "localhost" folder was missing, but I created the "localhost" folder manually and then rebooted. (rebooted a couple more times just to see if the localhost folder stays, and it did)

[root@freenas] /var/db/collectd/rrd# ls -l
total 5
drwxr-xr-x 3 root wheel 4 Jan 27 00:42 ./
drwxr-xr-x 7 root wheel 9 Jan 26 22:47 ../
lrwxr-xr-x 1 root wheel 9 Jan 27 00:42 freenas.domain.local@ -> localhost
drwxr-xr-x 28 root wheel 28 Jan 27 00:43 localhost/
[root@freenas] /var/db/collectd/rrd#

Thanks.

That's funny. I did a fresh install on one of my servers to replace the USB sticks with SSDs, imported the config, and all reports are working fine.
 
Status
Not open for further replies.
Top