FreeNAS 9.10 STABLE keeps dropping iSCSI connection

Status
Not open for further replies.

abcslayer

Dabbler
Joined
Dec 9, 2014
Messages
42
Hi,

It's me again. This time I met the trouble with newest FreeNAS update: FreeNAS-9.10-STABLE-201606072003 (696eba7).
  • I used to meet this bug previously (https://forums.freenas.org/index.php?threads/freenas-9-3-stable-upgrading-issue-from-9-2-1-9.25462/) and can not fix it completely despite of trying to change VMXNET3 adapter setting (disable TSO, change MTU.....).
  • With some previous FreeNAS 9.10 updates I did not see the errors happened (maybe I did not stress test my system often now) but with this newest update, it is very easy to spot the error in the logs and replicate it. I have just fire update command on 02 Windows Server 2012 VMs then the error appears (what?!!? very moderate/light IO load)
Some of the very familiar error show up in log (I cut down most of them, just list some to save space):
Jun 25 00:31:13 freenas WARNING: 192.168.10.2 (iqn.1998-01.com.vmware:xxx): no ping reply (NOP-Out) after 5 seconds; dropping connection
....
Jun 25 00:33:33 freenas ctl_datamove: tag 0xebbd2f on (0:3:0) aborted
....
Jun 25 00:35:22 freenas ctl_datamove: tag 0xebcb78 on (0:3:0) aborted
....
Jun 25 00:49:51 freenas ctl_datamove: tag 0xbe9a1e on (0:4:0) aborted
Jun 25 00:49:51 freenas ctl_datamove: tag 0xbe9a23 on (0:4:0) aborted
Jun 25 00:49:51 freenas ctl_datamove: tag 0xbe9a24 on (0:4:0) aborted
Jun 25 00:49:51 freenas ctl_datamove: tag 0xbe9a2f on (0:4:0) aborted
Jun 25 00:49:51 freenas ctl_datamove: tag 0xbe9a32 on (0:4:0) aborted
Jun 25 00:49:51 freenas ctl_datamove: tag 0xbe9a33 on (0:4:0) aborted
Jun 25 00:49:51 freenas ctl_datamove: tag 0xbe9a01 on (0:4:0) aborted
....
Jun 25 16:38:00 freenas ctld[65755]: 192.168.10.2: read: Connection reset by peer
Jun 25 16:38:00 freenas ctld[1675]: child process 65755 terminated with exit status 1
I saw lot of message from ctl_datamove with address (0:3:0) and (0:4:0), are they specific drives in my 04 drives pool.

The system load is unsual high and python2.7 processes consume so much of RAM:
last pid: 67242; load averages: 1.06, 1.14, 0.89 up 9+03:06:09 16:53:28
34 processes: 1 running, 33 sleeping
CPU: 1.0% user, 0.0% nice, 54.1% system, 0.0% interrupt, 44.9% idle
Mem: 193M Active, 3708M Inact, 3931M Wired, 21M Cache, 75M Free
ARC: 3171M Total, 1402M MFU, 1520M MRU, 2026K Anon, 169M Header, 78M Other
Swap: 8192M Total, 235M Used, 7957M Free, 2% Inuse

PID USERNAME THR PRI NICE SIZE RES STATE C TIME WCPU COMMAND
2886 root 12 20 0 231M 20220K nanslp 1 18:45 0.00% collectd
2062 root 2 20 0 66148K 6044K select 1 4:23 0.00% vmtoolsd
2610 root 1 52 0 217M 18516K select 1 3:51 0.00% python2.7
3831 root 2 20 0 111M 9512K select 1 2:00 0.00% python2.7
2638 root 6 20 0 370M 121M select 1 1:15 0.00% python2.7
1431 root 2 20 0 68924K 2816K kqread 1 1:04 0.00% syslog-ng
1143 root 1 20 0 3705M 3622M select 1 0:45 0.00% devd
1753 root 1 20 0 30260K 18104K select 1 0:20 0.00% ntpd
3463 root 1 20 0 51704K 2428K select 1 0:14 0.00% zfsd
2382 root 1 32 10 17064K 908K wait 1 0:02 0.00% sh
94451 www 1 20 0 34116K 2148K kqread 1 0:01 0.00% nginx
3473 root 1 20 0 20740K 660K nanslp 1 0:01 0.00% cron
3525 root 1 52 0 161M 5256K ttyin 0 0:00 0.00% python2.7
2977 root 4 52 0 169M 5596K usem 0 0:00 0.00% python2.7
2364 root 1 20 0 30724K 1256K nanslp 1 0:00 0.00% smartd
1675 root 1 20 0 25328K 2048K select 1 0:00 0.00% ctld

[root@freenas ~]# top | grep "python2.7"
2638 root 6 20 0 370M 122M select 1 1:21 0.78% python2.7
3831 root 2 20 0 111M 9532K select 0 2:00 0.49% python2.7
2610 root 1 52 0 217M 18516K select 0 3:51 0.10% python2.7
3525 root 1 52 0 161M 5256K ttyin 0 0:00 0.00% python2.7
2977 root 4 52 0 169M 5596K usem 0 0:00 0.00% python2.7

I found the ARC is very small too, normally it would take more than 6.5GB of RAM in total 8GB.

I really dont know how to fix this mess now :(

My system configuration:
  • SuperMicro X10SL7-F
  • 32GB ECC DDR3 (04 modules 8GB)
  • Intel E3-1231v3
  • 04 Intel 530 SSD
  • 01 Toshiba 120GB SSD to keep essential VM volumes (FreeNAS + firewall)
  • 01 USB flash to boot VMWare
ZFS config using 04 Intel 530 SSD in strip+mirror vdevs
VMWare main VMs volumes use iSCSI connection from FreeNAS VM (All-in-one box)

My current kernel tuning:
hw.pci.enable_msi = 1
hw.pci.enable_msix = 0 (prevent interrupt stomp bug)
kern.icl.coalesce = 0
vmxnet3_load = YES
 
Last edited:

Mirfster

Doesn't know what he's talking about
Joined
Oct 2, 2015
Messages
3,215
So you are running ESXi with a VM that is FreeNAS correct? If so, have you Locked the RAM allocated to FreeNAS as well as set the CPU to "High"? How much RAM are you allocating to the FreeNAS VM?
 

Spearfoot

He of the long foot
Moderator
Joined
May 13, 2015
Messages
2,478
Hi,

It's me again. This time I met the trouble with newest FreeNAS update: FreeNAS-9.10-STABLE-201606072003 (696eba7).
  • I used to meet this bug previously (https://forums.freenas.org/index.php?threads/freenas-9-3-stable-upgrading-issue-from-9-2-1-9.25462/) and can not fix it completely despite of trying to change VMXNET3 adapter setting (disable TSO, change MTU.....).
  • With some previous FreeNAS 9.10 updates I did not see the errors happened (maybe I did not stress test my system often now) but with this newest update, it is very easy to spot the error in the logs and replicate it. I have just fire update command on 02 Windows Server 2012 VMs then the error appears (what?!!? very moderate/light IO load)
Some of the very familiar error show up in log (I cut down most of them, just list some to save space):

I saw lot of message from ctl_datamove with address (0:3:0) and (0:4:0), are they specific drives in my 04 drives pool.

The system load is unsual high and python2.7 processes consume so much of RAM:


I found the ARC is very small too, normally it would take more than 6.5GB of RAM in total 8GB.

I really dont know how to fix this mess now :(

My system configuration:
  • SuperMicro X10SL7-F
  • 32GB ECC DDR3 (04 modules 8GB)
  • Intel E3-1231v3
  • 04 Intel 530 SSD
  • 01 Toshiba 120GB SSD to keep essential VM volumes (FreeNAS + firewall)
  • 01 USB flash to boot VMWare
ZFS config using 04 Intel 530 SSD in strip+mirror vdevs
VMWare main VMs volumes use iSCSI connection from FreeNAS VM (All-in-one box)
I have an all-in-one system much like yours, based on a Supermicro X10SL7-F, and had the same problem with iSCSI. Was never able to get it to work. Finally gave up and switched to NFS for providing a datastore back to VMware.

Here's the relevant bug report (my comment is #25):

https://bugs.freenas.org/issues/7622
 

abcslayer

Dabbler
Joined
Dec 9, 2014
Messages
42
So you are running ESXi with a VM that is FreeNAS correct? If so, have you Locked the RAM allocated to FreeNAS as well as set the CPU to "High"? How much RAM are you allocating to the FreeNAS VM?
I have an all-in-one system much like yours, based on a Supermicro X10SL7-F, and had the same problem with iSCSI. Was never able to get it to work. Finally gave up and switched to NFS for providing a datastore back to VMware.

Here's the relevant bug report (my comment is #25):

https://bugs.freenas.org/issues/7622

I have this bug in 9.3 and reported it here (https://forums.freenas.org/index.php?threads/freenas-9-3-stable-upgrading-issue-from-9-2-1-9.25462/), after I used the tuning parameter as suggested from a member, the bug is still there but it is harder to spot (e.g in very high load it appear) and I keep using 9.3. I upgraded my system to 9.10 and it is still OK until the most recent update :(

So you are running ESXi with a VM that is FreeNAS correct? If so, have you Locked the RAM allocated to FreeNAS as well as set the CPU to "High"? How much RAM are you allocating to the FreeNAS VM?

I have locked all 8GB to the VM, restart the whole server, the situation is still the same, for CPU I just reserve some for it (about 1GHz) but our system is not in overloading or over-subscribing situation (the host is still have free RAM and all VM is not overloading CPU).

The most important thing is the system was still running OK until the most recent update.
 

abcslayer

Dabbler
Joined
Dec 9, 2014
Messages
42
After the whole server restart I have not received NOP-Out connection dropping event yet (VMWare lost iSCSI connection to FreeNAS VM) but there are many events about high IO latency (e.g: Device t10.FreeBSD_iSCSI_Disk______000c29e873c1010________________ performance has deteriorated. I/O latency increased from average value of 2655 microseconds to 62118 microseconds. warning 6/26/2016 12:36:09 PM). Look at the number and you want to fall of your chair :|:eek:

ARC memory is about 6.0GB now, I will keep watching this number.
 

Mirfster

Doesn't know what he's talking about
Joined
Oct 2, 2015
Messages
3,215
8 GB is the minimum recommended for a normal FreeNAS system, with you running it as a VM and using iSCSI; I think that it is very much under-powered.

How full is your pool and how much fragmentation?
 

Spearfoot

He of the long foot
Moderator
Joined
May 13, 2015
Messages
2,478
After the whole server restart I have not received NOP-Out connection dropping event yet (VMWare lost iSCSI connection to FreeNAS VM) but there are many events about high IO latency (e.g: Device t10.FreeBSD_iSCSI_Disk______000c29e873c1010________________ performance has deteriorated. I/O latency increased from average value of 2655 microseconds to 62118 microseconds. warning 6/26/2016 12:36:09 PM). Look at the number and you want to fall of your chair :|:eek:

ARC memory is about 6.0GB now, I will keep watching this number.
You're using the VMXNET3 driver, right? Or have you switched to the E1000?
 

maglin

Patron
Joined
Jun 20, 2015
Messages
299
ISCSI requires RAM. 8GB is minimum for FreeNAS as a storage appliance. Try locking 16GB of RAM to FreeNAS and try again. That is why you are seeing the strange ARC behavior. I believe you might have picked the wrong system to run ESXi on with FreeNAS inside it. You are very RAM limited. Although I do like your system.
 

abcslayer

Dabbler
Joined
Dec 9, 2014
Messages
42
Hi,

I still use VMXNET3 as switching to E1000 did not fix it previously. Beside FreeNAS, I also use pfSense as a VM and there is no problem with VMXNET3.
8GB and iSCSI has been running for years, I know for many people it is small but why I choose this number?
  • I don't use dedup
  • All drives in the pool are SSDs at the same time IO demand from my system is small (only 02 Windows server VM running small SQL databases) so 6-7GB of RAM cache for IO is more than enough.
The most noticeable things are:
  • The system was totally fine with FreeNAS 9.2
  • The issue started appear with early 9.3 versions (reported here also), with later version it is much less and now reappear again with this recent 9.10 update (earlier ones don't have)
  • I also try other VMs: Nexenta, Quantastor, NAS4Free (long time ago, around FreeNAS 9.0-9.2 time), they do not have issues like this. I like FreeNAS so I keep using it.
 

Spearfoot

He of the long foot
Moderator
Joined
May 13, 2015
Messages
2,478
@Mirfster , @maglin : @abcslayer is experiencing exactly the same problem I did w/ iSCSI timing out, as described in bug #7622. The problem seems to have cropped up with the release of 9.3. It may be specific to users like abcslayer and myself who are running FreeNAS in a VM on VMware, but I am aware of at least one user who had the same problem while running on bare metal.

During my testing, I tried both the VMXNET3 and E1000 network drivers, 16GB of RAM, standard and jumbo MTU sizes, and various vCPU counts ranging from 2 to 4. Regardless, iSCSI would always fail under load; so I switched to NFS datastores.
 

Mirfster

Doesn't know what he's talking about
Joined
Oct 2, 2015
Messages
3,215
During my testing, I tried both the VMXNET3 and E1000 network drivers
Not sure, but have you tried using the native ESXi VMXNet3 Drivers instead of those provided by default in FreeNAS 9.10? I don't run iSCSI right now, but it may be worth a shot...

I wrote instructions for how to do it in this thread (last comment on that page): "My Dream System (I think)"
 

Mirfster

Doesn't know what he's talking about
Joined
Oct 2, 2015
Messages
3,215
Just was reading that Bug report and noticed that the last post mentioned:
I resolved by properly setting each subnet in its own vlan so that one interface does not see traffic destined for another. Speeds are normal (240 MB/s with 2 1 gb interfaces) and the error messages in freenas as well as in windows (unable to send a PDU) are gone.

So, in ESXi are you all ensuring that you are running iSCSI on its own separate vSwitch, NIC, IP and SubNet? Again, just a guess here...
 

Spearfoot

He of the long foot
Moderator
Joined
May 13, 2015
Messages
2,478

Spearfoot

He of the long foot
Moderator
Joined
May 13, 2015
Messages
2,478

Mirfster

Doesn't know what he's talking about
Joined
Oct 2, 2015
Messages
3,215

Spearfoot

He of the long foot
Moderator
Joined
May 13, 2015
Messages
2,478
Okay, okay! I set up iSCSI on my test system and ran my standard "Force iSCSI To Fail" test: run the Atto benchmark simultaneously on two VMs. Lo and behold, it didn't fail! Previously this would reliably force timeout errors like this:
Code:
WARNING: 10.0.58.1 (iqn.1998-01.com.vmware:554fa508-b47d-0416-fffc-0cc47a3419a2-2889c35f): no ping reply (NOP-Out) after 5 seconds; dropping connection

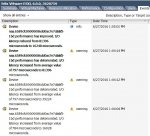
However, I did see these warnings in vSphere:
Code:
Device xxx performance has deteriorated. I/O
latency increased from average value
of 1544 microseconds to 140607
microseconds.
warning
6/27/2016 11:21:39 AM
fritz

I ran the test multiple times, both with and without sync enabled on the iSCSI dataset.

This is on an older Supermicro X8SIE system (details in 'my systems' below), not the X10SL7 I tested last year. And I now lock the FreeNAS VM memory whereas I didn't know to do this a year ago.

If time and energy permit, I will set up this test on my X10Sl7-based production system and report my results here.

In the meantime, I recommend that @abcslayer make these changes to his FreeNAS virtual machine and then re-test:

1> Increase memory to 12-16GB (from the current 8GB) and be sure to reserve all of it
2> Set a 500MHz CPU reservation, with "Shares:" set to "High"
 

Spearfoot

He of the long foot
Moderator
Joined
May 13, 2015
Messages
2,478
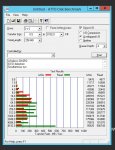
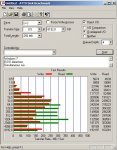
I've re-tested iSCSI on my main server (see 'my systems' below) with pretty much the same results I posted earlier when reporting results from my test server. Performance seems 'choppy' when I run the Atto benchmark simultaneously on two VMs - but I am unable to reproduce the timeout failure this test caused a year ago during my initial FreeNAS/iSCSI evaluation:

iscsi-test-1.jpg iscsi-test-2.jpg

I see the same I/O latency warnings in vSphere:
iscsi-test-3.jpg

I get over 200MB/s I/O rates from the iSCSI datastore, which ain't bad, considering that it's based on spinning rust:
iscsi-test-4.jpg

To re-iterate, I recommend that @abcslayer reconfigure his FreeNAS VM with more memory and so on, as I mentioned earlier.

EDIT: Other things to consider: I am using the E1000 driver, not VMXNET3. I'm using the standard MTU size of 1500, not 9000. I have a virtual storage network set up on a separate vswitch with its own subnet.
 
Last edited:

abcslayer

Dabbler
Joined
Dec 9, 2014
Messages
42
Hi, I have updated to newest patch which has just been released (FreeNAS-9.10-STABLE-201606270534 (dd17351)) and the connection dropping has gone. From the short change log I saw something about delayed ACK. The ARC now is about 6.5-6.6G.

With same configuration, and heavy bench mark, I can put more than 500/300 (MB/s) IO easily and the virtual network bandwith for up and down would be around 5.8/4.2Gbps. For my configuration, the iSCSI network is staying in separated vSwitch. The reason for me to use VMXNET3 is potential of lower CPU usage under load (virtual E1000 can reach 10Gbps too despite of it is "Gigabit" adapter)

Under heavy load, there are still lot of messages like this:
Device t10.FreeBSD_iSCSI_Disk______000c29e873c1010________________ performance has deteriorated. I/O latency increased from average value of 1964 microseconds to 178924 microseconds. warning
6/28/2016 6:15:01 PM

So the root cause of the performance issue might still be there inside the kernel iSCSI. I believe that my system can run at higher IO rate (because current benchmark result show that the whole iSCSI zvol performance is similar to a single SSD). Of course, in my benchmark I use test file that is bigger than ARC size to test real IO performance.

The delayed ACK might just help prevent connection dropping under heavy IO load but the reason why iSCSI kernel module could not help saturate the IO potential we could not know.
 
Last edited:

abcslayer

Dabbler
Joined
Dec 9, 2014
Messages
42
Hi,

I got a NOP-Out:
Jun 30 00:35:51 freenas WARNING: 192.168.10.2 (iqn.1998-01.com.vmware:5436d812-1b9d-676a-6755-0cc47a30227a-6413931f): no ping reply (NOP-Out) after 5 seconds; dropping connection
Checked the RRD graph:
  • There was some iSCSI IOs at around max 192MB/s read and 114MB/s write.
  • ARC memory reduced from 6.2GB to 6.0GB at that moment, hit rate reduced from 74.9% to around 70.9%
My current ARC is reduced to 5.9GB. (min 5.8GB)
In VMWare event log, beside connection lost near the NOP-Out time, there are also IO latency increased events scattering in various occasion.
I think the 9.10 has problem with memory leakage and the kernel iSCSI still have serious issues. Normally my ARC never went lower than 6.0GB and no swapping happen, here below is the result from top (uptime just more than 1 day):
Code:
last pid: 80687;  load averages:  0.39,  0.29,  0.27    up 1+19:18:31  13:22:58
36 processes:  1 running, 35 sleeping                                          
CPU:  1.0% user,  0.0% nice,  0.0% system,  0.0% interrupt, 99.0% idle         
Mem: 84M Active, 1061M Inact, 6712M Wired, 23M Cache, 47M Free                 
ARC: 6099M Total, 2543M MFU, 3107M MRU, 450K Anon, 303M Header, 146M Other     
Swap: 8192M Total, 63M Used, 8128M Free


Thanks,
 
Status
Not open for further replies.
Top