Low read speeds Dell R720xd

Status
Not open for further replies.

XenonXTZ

Dabbler
Joined
Jan 13, 2017
Messages
22
Hi, guys,
I'm messing with FreeNAS 9.10.2 U3 for quite a while so far and I still have 1 unresolvable issue.

I have a Dell PE R720xd.
24x 300GB SAS drives.
1x Intel P3605 1.6TB AiC
2x Intel X520-SR2 (10Gbit)
Dell N4032F switch with LACP support
E5-2640 0 x 2
256GB RAM
LSI 9207-8i HBA

I have a stripped mirror setup. 11 mirrors, totaling 2.9TB, 2x spare drives and the whole SSD dedicated to ZIL.
Here's my issue. Always, no matter how I test, my reads are slower than writes.
Autotune is enabled in FreeNAS.
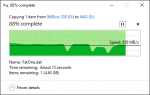
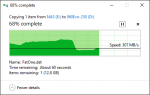
For example reading the 40-50GB file is averaging at 300 MByte/s, while the same file written is averaging at 800-850 Mbyte/s.
Theoretically my 11 mirror stripe throughput should be around 11x150 Mbyte/s (single drive perf), but I'm not getting even close to that number.
My network is aggregated, 4 uplinks right now (so that I'd not blame network) LACP configured.
On a test PC I have a Dell desktop with Samsung 960 Evo with AiC as a test storage and a single X520-SR2 with both NICs teamed via LACP.
Aggregation is properly configured on the switch side.
Jumbo frames have been tested as well. Not a big change.
Dedup is off, compression is enabled.
iSCSI.

Weird thing, when that aforementioned 40GB file is read the activity LED is hardly flashing, I'd say once in 10 seconds or so, while when writing the same file - pool's all active HDDs show LED activity.

Please share some thoughts as I'm out of ideas.
Thank you!
 

joeschmuck

Old Man
Moderator
Joined
May 28, 2011
Messages
10,994
Always, no matter how I test, my reads are slower than writes.
This is not abnormal. "Explain this to me" you say... Easy... During a write operation you are writing to RAM first, this is high speed stuff. The data eventually gets written to the drive. So you have high speed writes and with all that RAM you got, you are going to have a fast system for file writes.

The reading is simple to explain too... If you read a file then you first have to get it from the slow hard drives, this takes time. Eventually the ARC (in RAM) will copy the file you are reading once the ARC determines it should be cached, once that happens the reading of the file will be significantly faster.

I can't speak to the throughput of the mirrors.
 

m0nkey_

MVP
Joined
Oct 27, 2015
Messages
2,739
and the whole SSD dedicated to ZIL
Detach the ZIL for now, unless you have a specific requirement for synchronous writes.
Autotune is enabled in FreeNAS.
Turn that off. Delete any tunables it created and reboot. Autotune should not be used and has only a few use cases where it should be.
My network is aggregated, 4 uplinks right now (so that I'd not blame network) LACP configured.
Kill the LAGG for now. Use just one interface to rule out the LAGG.
 

Spearfoot

He of the long foot
Moderator
Joined
May 13, 2015
Messages
2,478
Have you tested your network connection with iperf? That would eliminate any networking quirks...
 

XenonXTZ

Dabbler
Joined
Jan 13, 2017
Messages
22
This is not abnormal. "Explain this to me" you say... Easy... During a write operation you are writing to RAM first, this is high speed stuff. The data eventually gets written to the drive. So you have high speed writes and with all that RAM you got, you are going to have a fast system for file writes.

The reading is simple to explain too... If you read a file then you first have to get it from the slow hard drives, this takes time. Eventually the ARC (in RAM) will copy the file you are reading once the ARC determines it should be cached, once that happens the reading of the file will be significantly faster.

I can't speak to the throughput of the mirrors.
I understand all this, but the thing that worries me is the no activity on LEDs when reading a 40G file. Very strange. That makes me think that the data that's being read is cached, thus the drive performance should not be counted and therefore the issue is within configuration or hardware.

Detach the ZIL for now
I decided to start from scratch and will follow your advices. ZIL will be detached, there will be no autotune and will start with a single 10gbe.

Have you tested your network connection with iperf? That would eliminate any networking quirks...
No, Sir, I haven't. But I'd expect read and write to be on par at least. Read, in my situation, is less than write.

I will report back soon.
Thank you for your inputs, guys.
I appreciate that!
 

XenonXTZ

Dabbler
Joined
Jan 13, 2017
Messages
22
Hi again.
Here are the results with a clean configuration on a single 10Gbit connection with no SLOG attached.
Write:

Read:


I checked again, when the written file is read from the FreeNAS storage - there's no activity at all on the LEDs or the disk activity in GUI Reporting.

Any ideas, please...
 

Attachments

  • Write.png
    Write.png
    9.8 KB · Views: 416
  • Read.png
    Read.png
    7.8 KB · Views: 423

joeschmuck

Old Man
Moderator
Joined
May 28, 2011
Messages
10,994
I don't put a lot of faith in the activity LEDs myself. Sometimes they lie.

A few questions with answers...
1) I agree that you should use iperf to see what the results are.
2) What protocol are you using? Whatever it is, try a different one.
3) If it's possible, directly connect your test computer to the FreeNAS computer and test again, assuming iperf shows bad results.
4) You are making an assumption that the slow read speed is the fault of FreeNAS. It could be the PC you are testing with so replace it with something completely different and test again.

You need to do a lot of testing and you will likely find the issue but you should use iperf.
 

XenonXTZ

Dabbler
Joined
Jan 13, 2017
Messages
22
I don't put a lot of faith in the activity LEDs myself. Sometimes they lie.

A few questions with answers...
1) I agree that you should use iperf to see what the results are.
2) What protocol are you using? Whatever it is, try a different one.
3) If it's possible, directly connect your test computer to the FreeNAS computer and test again, assuming iperf shows bad results.
4) You are making an assumption that the slow read speed is the fault of FreeNAS. It could be the PC you are testing with so replace it with something completely different and test again.

You need to do a lot of testing and you will likely find the issue but you should use iperf.
1. I'm not certain on how to use iPerf. I will look it up and will report back.
2. When you say protocol, what do you mean, if you don't mind?
3. I will try direct connection tomorrow, once I get to work.
4. My test PC is a Dell OptiPlex 990 with i7 Sandy, 8GB RAM, S3700 100GB with Server 2016 on it. A test storage only device Samsung 960 Evo that benched seq. 1.4GByte R/W performance in CrystalDiskMark.
Before, the test PC was even a better server, PE R730xd with a single E5-2620 v4, 96GB RAM, H330 controller, with stripe of 2x 200GB Toshiba PX04S Enterprise SSD with 1.7GByte/s R/W.
I'm ruling out the test machine factor. I was getting the same performance on that machine.
 

XenonXTZ

Dabbler
Joined
Jan 13, 2017
Messages
22
I guess this is no good.
This is with jumbo frames disabled, when enabled the Transfer increased to 1.75Gbit (it's on the pic)
I tried direct attach, avoiding my Dell N4032F switch.
The last 2 results are when direct attached.
Please..

TCP windows size didn't make any difference either.
Tried 512k and got about the same numbers.
2017-05-24_09-03-18.jpg
 

XenonXTZ

Dabbler
Joined
Jan 13, 2017
Messages
22
Update.
I'm not sure why, but direct connected FreeNAS and test machine now show close to 10Gbit throughput.
BUT, yet I'm having the same slow read speeds.
No activity on LEDs. All this data is cached in ARC and yet delivering this read speed...
I don't understand this.

NoSwitch_SameRes.jpg
 

Spearfoot

He of the long foot
Moderator
Joined
May 13, 2015
Messages
2,478
Update.
I'm not sure why, but direct connected FreeNAS and test machine now show close to 10Gbit throughput.
BUT, yet I'm having the same slow read speeds.
No activity on LEDs. All this data is cached in ARC and yet delivering this read speed...
I don't understand this.

View attachment 18497
You're on the right track...

Once you've determined that your network connection is running at near line speed you'll move on to discovering the other bottlenecks in the system, which will probably be determined by the speed of your disks.

Be sure to run your iperf tests going both ways, i.e., with the systems at each end running as both server and client. This insures that you have a good bi-directional connection. I did quite a bit of testing when I implemented 10GbE on my network last month; see "10GbE FreeNAS servers are constrained when receiving network data". I tried just about everything, and ended up discovering that simply enabling jumbo frames was all I needed to do to get over 9 Gigabits/second bandwidth; no tunables necessary:
bandit-10-gbe-after-jumbo-frames.jpg


These are the iperf commands I used when testing:
  • Server: iperf -s -fg
  • Client: iperf -c [server IP address] -t60 -i5 -fg
I've found that I get nowhere close to 9 Gigabits/second in the 'Real World', i.e., when copying files, running rsync, replicating datasets, etc., and I'm pretty sure this is owing to disk limitations.
 

XenonXTZ

Dabbler
Joined
Jan 13, 2017
Messages
22
Network is not an issue. I repeated the test with and w/o switch involved and was getting around 8.5GBit/s in iperf.
I can't believe that 11 vdevs (each theoretically delivering 150+MB/S) are not capable of passing 300-400MByte/s read mark!
When I check in GUI's reporting, all of my disks are chilling with max 30-40MB mark activity.
And yet there's no activity on read. The disks are not involved right at that moment when I'm reading that big file. It's being read from RAM and thus my disks are not the culprit. It's something else. It's not the network either. It is something Else.
 

m0nkey_

MVP
Joined
Oct 27, 2015
Messages
2,739
Can you paste the output of zpool status and arc_summary.py using the [ code ] tags.
 

XenonXTZ

Dabbler
Joined
Jan 13, 2017
Messages
22
Can you paste the output of zpool status and arc_summary.py using the [ code ] tags.
With pleasure.
Zpool Status
Code:
[root@freenas] ~# zpool status
  pool: freenas-boot
 state: ONLINE
  scan: none requested
config:

  NAME  STATE  READ WRITE CKSUM
  freenas-boot  ONLINE  0  0  0
  da24p2  ONLINE  0  0  0

errors: No known data errors

  pool: storage
 state: ONLINE
  scan: none requested
config:

  NAME  STATE  READ WRITE CKSUM
  storage  ONLINE  0  0  0
  mirror-0  ONLINE  0  0  0
  gptid/d8cbf66d-3fd1-11e7-8b3b-bc305bee6e20  ONLINE  0  0  0
  gptid/db4d79c1-3fd1-11e7-8b3b-bc305bee6e20  ONLINE  0  0  0
  mirror-1  ONLINE  0  0  0
  gptid/dddd69a9-3fd1-11e7-8b3b-bc305bee6e20  ONLINE  0  0  0
  gptid/e061b5e9-3fd1-11e7-8b3b-bc305bee6e20  ONLINE  0  0  0
  mirror-2  ONLINE  0  0  0
  gptid/e2e85d7a-3fd1-11e7-8b3b-bc305bee6e20  ONLINE  0  0  0
  gptid/e5768c7a-3fd1-11e7-8b3b-bc305bee6e20  ONLINE  0  0  0
  mirror-3  ONLINE  0  0  0
  gptid/e801edfe-3fd1-11e7-8b3b-bc305bee6e20  ONLINE  0  0  0
  gptid/ea8d7173-3fd1-11e7-8b3b-bc305bee6e20  ONLINE  0  0  0
  mirror-4  ONLINE  0  0  0
  gptid/ed18e37f-3fd1-11e7-8b3b-bc305bee6e20  ONLINE  0  0  0
  gptid/ef95dba9-3fd1-11e7-8b3b-bc305bee6e20  ONLINE  0  0  0
  mirror-5  ONLINE  0  0  0
  gptid/f22965ac-3fd1-11e7-8b3b-bc305bee6e20  ONLINE  0  0  0
  gptid/f4a8ddd1-3fd1-11e7-8b3b-bc305bee6e20  ONLINE  0  0  0
  mirror-6  ONLINE  0  0  0
  gptid/f73bcbbd-3fd1-11e7-8b3b-bc305bee6e20  ONLINE  0  0  0
  gptid/f9c47af3-3fd1-11e7-8b3b-bc305bee6e20  ONLINE  0  0  0
  mirror-7  ONLINE  0  0  0
  gptid/fc51e981-3fd1-11e7-8b3b-bc305bee6e20  ONLINE  0  0  0
  gptid/fecb0739-3fd1-11e7-8b3b-bc305bee6e20  ONLINE  0  0  0
  mirror-8  ONLINE  0  0  0
  gptid/0159b685-3fd2-11e7-8b3b-bc305bee6e20  ONLINE  0  0  0
  gptid/03dce469-3fd2-11e7-8b3b-bc305bee6e20  ONLINE  0  0  0
  mirror-9  ONLINE  0  0  0
  gptid/0662d7b8-3fd2-11e7-8b3b-bc305bee6e20  ONLINE  0  0  0
  gptid/08e4b2a1-3fd2-11e7-8b3b-bc305bee6e20  ONLINE  0  0  0
  mirror-10  ONLINE  0  0  0
  gptid/0b6eb070-3fd2-11e7-8b3b-bc305bee6e20  ONLINE  0  0  0
  gptid/0df1e66f-3fd2-11e7-8b3b-bc305bee6e20  ONLINE  0  0  0
  logs
  gptid/42cb1111-4083-11e7-8a77-bc305bee6e20  ONLINE  0  0  0
  spares
  gptid/10805cf1-3fd2-11e7-8b3b-bc305bee6e20  AVAIL
  gptid/130402c4-3fd2-11e7-8b3b-bc305bee6e20  AVAIL

errors: No known data errors


Arc Summary:
Code:
[root@freenas] ~# arc_summary.py
System Memory:

  0.14%  356.67  MiB Active,  0.14%  361.30  MiB Inact
  6.90%  17.20  GiB Wired,  0.00%  6.12  MiB Cache
  92.82%  231.46  GiB Free,  0.00%  0  Bytes Gap

  Real Installed:  256.00  GiB
  Real Available:  99.97%  255.93  GiB
  Real Managed:  97.43%  249.36  GiB

  Logical Total:  256.00  GiB
  Logical Used:  9.45%  24.18  GiB
  Logical Free:  90.55%  231.82  GiB

Kernel Memory:  1.15  GiB
  Data:  97.65%  1.13  GiB
  Text:  2.35%  27.68  MiB

Kernel Memory Map:  249.36  GiB
  Size:  3.93%  9.80  GiB
  Free:  96.07%  239.56  GiB
  Page:  1
------------------------------------------------------------------------

ARC Summary: (HEALTHY)
  Storage pool Version:  5000
  Filesystem Version:  5
  Memory Throttle Count:  0

ARC Misc:
  Deleted:  33
  Mutex Misses:  0
  Evict Skips:  0

ARC Size:  4.43%  11.01  GiB
  Target Size: (Adaptive)  100.00% 248.36  GiB
  Min Size (Hard Limit):  12.50%  31.04  GiB
  Max Size (High Water):  8:1  248.36  GiB

ARC Size Breakdown:
  Recently Used Cache Size:  50.00%  124.18  GiB
  Frequently Used Cache Size:  50.00%  124.18  GiB

ARC Hash Breakdown:
  Elements Max:  2.66m
  Elements Current:  100.00% 2.66m
  Collisions:  100.19k
  Chain Max:  3
  Chains:  95.46k
  Page:  2
------------------------------------------------------------------------

ARC Total accesses:  5.13m
  Cache Hit Ratio:  48.01%  2.46m
  Cache Miss Ratio:  51.99%  2.67m
  Actual Hit Ratio:  46.89%  2.40m

  Data Demand Efficiency:  89.72%  2.66m
  Data Prefetch Efficiency:  2.17%  2.44m

  CACHE HITS BY CACHE LIST:
  Anonymously Used:  2.33%  57.46k
  Most Recently Used:  97.53%  2.40m
  Most Frequently Used:  0.14%  3.45k
  Most Recently Used Ghost:  0.00%  0
  Most Frequently Used Ghost:  0.00%  0

  CACHE HITS BY DATA TYPE:
  Demand Data:  97.11%  2.39m
  Prefetch Data:  2.15%  52.82k
  Demand Metadata:  0.56%  13.68k
  Prefetch Metadata:  0.19%  4.65k

  CACHE MISSES BY DATA TYPE:
  Demand Data:  10.27%  273.85k
  Prefetch Data:  89.40%  2.38m
  Demand Metadata:  0.18%  4.80k
  Prefetch Metadata:  0.15%  4.10k
  Page:  3
------------------------------------------------------------------------

  Page:  4
------------------------------------------------------------------------

DMU Prefetch Efficiency:  603.72k
  Hit Ratio:  24.66%  148.89k
  Miss Ratio:  75.34%  454.83k

  Page:  5
------------------------------------------------------------------------

  Page:  6
------------------------------------------------------------------------

ZFS Tunable (sysctl):
  kern.maxusers  16715
  vm.kmem_size  267748065280
  vm.kmem_size_scale  1
  vm.kmem_size_min  0
  vm.kmem_size_max  1319413950874
  vfs.zfs.vol.unmap_enabled  1
  vfs.zfs.vol.mode  2
  vfs.zfs.sync_pass_rewrite  2
  vfs.zfs.sync_pass_dont_compress  5
  vfs.zfs.sync_pass_deferred_free  2
  vfs.zfs.zio.dva_throttle_enabled  1
  vfs.zfs.zio.exclude_metadata  0
  vfs.zfs.zio.use_uma  1
  vfs.zfs.zil_slog_limit  786432
  vfs.zfs.cache_flush_disable  0
  vfs.zfs.zil_replay_disable  0
  vfs.zfs.version.zpl  5
  vfs.zfs.version.spa  5000
  vfs.zfs.version.acl  1
  vfs.zfs.version.ioctl  7
  vfs.zfs.debug  0
  vfs.zfs.super_owner  0
  vfs.zfs.min_auto_ashift  12
  vfs.zfs.max_auto_ashift  13
  vfs.zfs.vdev.queue_depth_pct  1000
  vfs.zfs.vdev.write_gap_limit  4096
  vfs.zfs.vdev.read_gap_limit  32768
  vfs.zfs.vdev.aggregation_limit  131072
  vfs.zfs.vdev.trim_max_active  64
  vfs.zfs.vdev.trim_min_active  1
  vfs.zfs.vdev.scrub_max_active  2
  vfs.zfs.vdev.scrub_min_active  1
  vfs.zfs.vdev.async_write_max_active  10
  vfs.zfs.vdev.async_write_min_active  1
  vfs.zfs.vdev.async_read_max_active  3
  vfs.zfs.vdev.async_read_min_active  1
  vfs.zfs.vdev.sync_write_max_active  10
  vfs.zfs.vdev.sync_write_min_active  10
  vfs.zfs.vdev.sync_read_max_active  10
  vfs.zfs.vdev.sync_read_min_active  10
  vfs.zfs.vdev.max_active  1000
  vfs.zfs.vdev.async_write_active_max_dirty_percent60
  vfs.zfs.vdev.async_write_active_min_dirty_percent30
  vfs.zfs.vdev.mirror.non_rotating_seek_inc1
  vfs.zfs.vdev.mirror.non_rotating_inc  0
  vfs.zfs.vdev.mirror.rotating_seek_offset1048576
  vfs.zfs.vdev.mirror.rotating_seek_inc  5
  vfs.zfs.vdev.mirror.rotating_inc  0
  vfs.zfs.vdev.trim_on_init  1
  vfs.zfs.vdev.larger_ashift_minimal  0
  vfs.zfs.vdev.bio_delete_disable  0
  vfs.zfs.vdev.bio_flush_disable  0
  vfs.zfs.vdev.cache.bshift  16
  vfs.zfs.vdev.cache.size  0
  vfs.zfs.vdev.cache.max  16384
  vfs.zfs.vdev.metaslabs_per_vdev  200
  vfs.zfs.vdev.trim_max_pending  10000
  vfs.zfs.txg.timeout  5
  vfs.zfs.trim.enabled  1
  vfs.zfs.trim.max_interval  1
  vfs.zfs.trim.timeout  30
  vfs.zfs.trim.txg_delay  32
  vfs.zfs.space_map_blksz  4096
  vfs.zfs.spa_min_slop  134217728
  vfs.zfs.spa_slop_shift  5
  vfs.zfs.spa_asize_inflation  24
  vfs.zfs.deadman_enabled  1
  vfs.zfs.deadman_checktime_ms  5000
  vfs.zfs.deadman_synctime_ms  1000000
  vfs.zfs.debug_flags  0
  vfs.zfs.recover  0
  vfs.zfs.spa_load_verify_data  1
  vfs.zfs.spa_load_verify_metadata  1
  vfs.zfs.spa_load_verify_maxinflight  10000
  vfs.zfs.ccw_retry_interval  300
  vfs.zfs.check_hostid  1
  vfs.zfs.mg_fragmentation_threshold  85
  vfs.zfs.mg_noalloc_threshold  0
  vfs.zfs.condense_pct  200
  vfs.zfs.metaslab.bias_enabled  1
  vfs.zfs.metaslab.lba_weighting_enabled  1
  vfs.zfs.metaslab.fragmentation_factor_enabled1
  vfs.zfs.metaslab.preload_enabled  1
  vfs.zfs.metaslab.preload_limit  3
  vfs.zfs.metaslab.unload_delay  8
  vfs.zfs.metaslab.load_pct  50
  vfs.zfs.metaslab.min_alloc_size  33554432
  vfs.zfs.metaslab.df_free_pct  4
  vfs.zfs.metaslab.df_alloc_threshold  131072
  vfs.zfs.metaslab.debug_unload  0
  vfs.zfs.metaslab.debug_load  0
  vfs.zfs.metaslab.fragmentation_threshold70
  vfs.zfs.metaslab.gang_bang  16777217
  vfs.zfs.free_bpobj_enabled  1
  vfs.zfs.free_max_blocks  18446744073709551615
  vfs.zfs.no_scrub_prefetch  0
  vfs.zfs.no_scrub_io  0
  vfs.zfs.resilver_min_time_ms  3000
  vfs.zfs.free_min_time_ms  1000
  vfs.zfs.scan_min_time_ms  1000
  vfs.zfs.scan_idle  50
  vfs.zfs.scrub_delay  4
  vfs.zfs.resilver_delay  2
  vfs.zfs.top_maxinflight  32
  vfs.zfs.delay_scale  500000
  vfs.zfs.delay_min_dirty_percent  60
  vfs.zfs.dirty_data_sync  67108864
  vfs.zfs.dirty_data_max_percent  10
  vfs.zfs.dirty_data_max_max  4294967296
  vfs.zfs.dirty_data_max  4294967296
  vfs.zfs.max_recordsize  1048576
  vfs.zfs.zfetch.array_rd_sz  1048576
  vfs.zfs.zfetch.max_distance  8388608
  vfs.zfs.zfetch.min_sec_reap  2
  vfs.zfs.zfetch.max_streams  8
  vfs.zfs.prefetch_disable  0
  vfs.zfs.send_holes_without_birth_time  1
  vfs.zfs.mdcomp_disable  0
  vfs.zfs.nopwrite_enabled  1
  vfs.zfs.dedup.prefetch  1
  vfs.zfs.l2c_only_size  0
  vfs.zfs.mfu_ghost_data_esize  0
  vfs.zfs.mfu_ghost_metadata_esize  0
  vfs.zfs.mfu_ghost_size  0
  vfs.zfs.mfu_data_esize  71094272
  vfs.zfs.mfu_metadata_esize  97543168
  vfs.zfs.mfu_size  173697536
  vfs.zfs.mru_ghost_data_esize  0
  vfs.zfs.mru_ghost_metadata_esize  0
  vfs.zfs.mru_ghost_size  0
  vfs.zfs.mru_data_esize  10862389760
  vfs.zfs.mru_metadata_esize  20043264
  vfs.zfs.mru_size  11044941312
  vfs.zfs.anon_data_esize  0
  vfs.zfs.anon_metadata_esize  0
  vfs.zfs.anon_size  168960
  vfs.zfs.l2arc_norw  1
  vfs.zfs.l2arc_feed_again  1
  vfs.zfs.l2arc_noprefetch  1
  vfs.zfs.l2arc_feed_min_ms  200
  vfs.zfs.l2arc_feed_secs  1
  vfs.zfs.l2arc_headroom  2
  vfs.zfs.l2arc_write_boost  8388608
  vfs.zfs.l2arc_write_max  8388608
  vfs.zfs.arc_meta_limit  66668580864
  vfs.zfs.arc_free_target  453200
  vfs.zfs.compressed_arc_enabled  1
  vfs.zfs.arc_shrink_shift  7
  vfs.zfs.arc_average_blocksize  8192
  vfs.zfs.arc_min  33334290432
  vfs.zfs.arc_max  266674323456
  Page:  7
------------------------------------------------------------------------

 
Status
Not open for further replies.
Top