Hey Everyone -
First off thanks to anyone who takes the time to give me a hand with this, I'm building a customized Grafana dashboard based off of the one given for free off of Grafana's site.
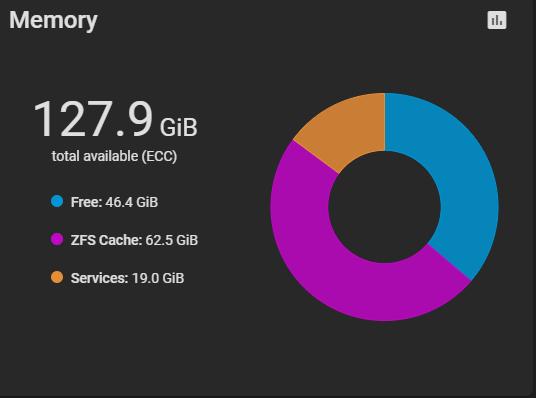
I got almost everything working, but I cant seem to find the metrics for the amount of memory that services are using to match up with whats showing up on the main page of truenas itself:
as you can see here, services are using about 19GB.

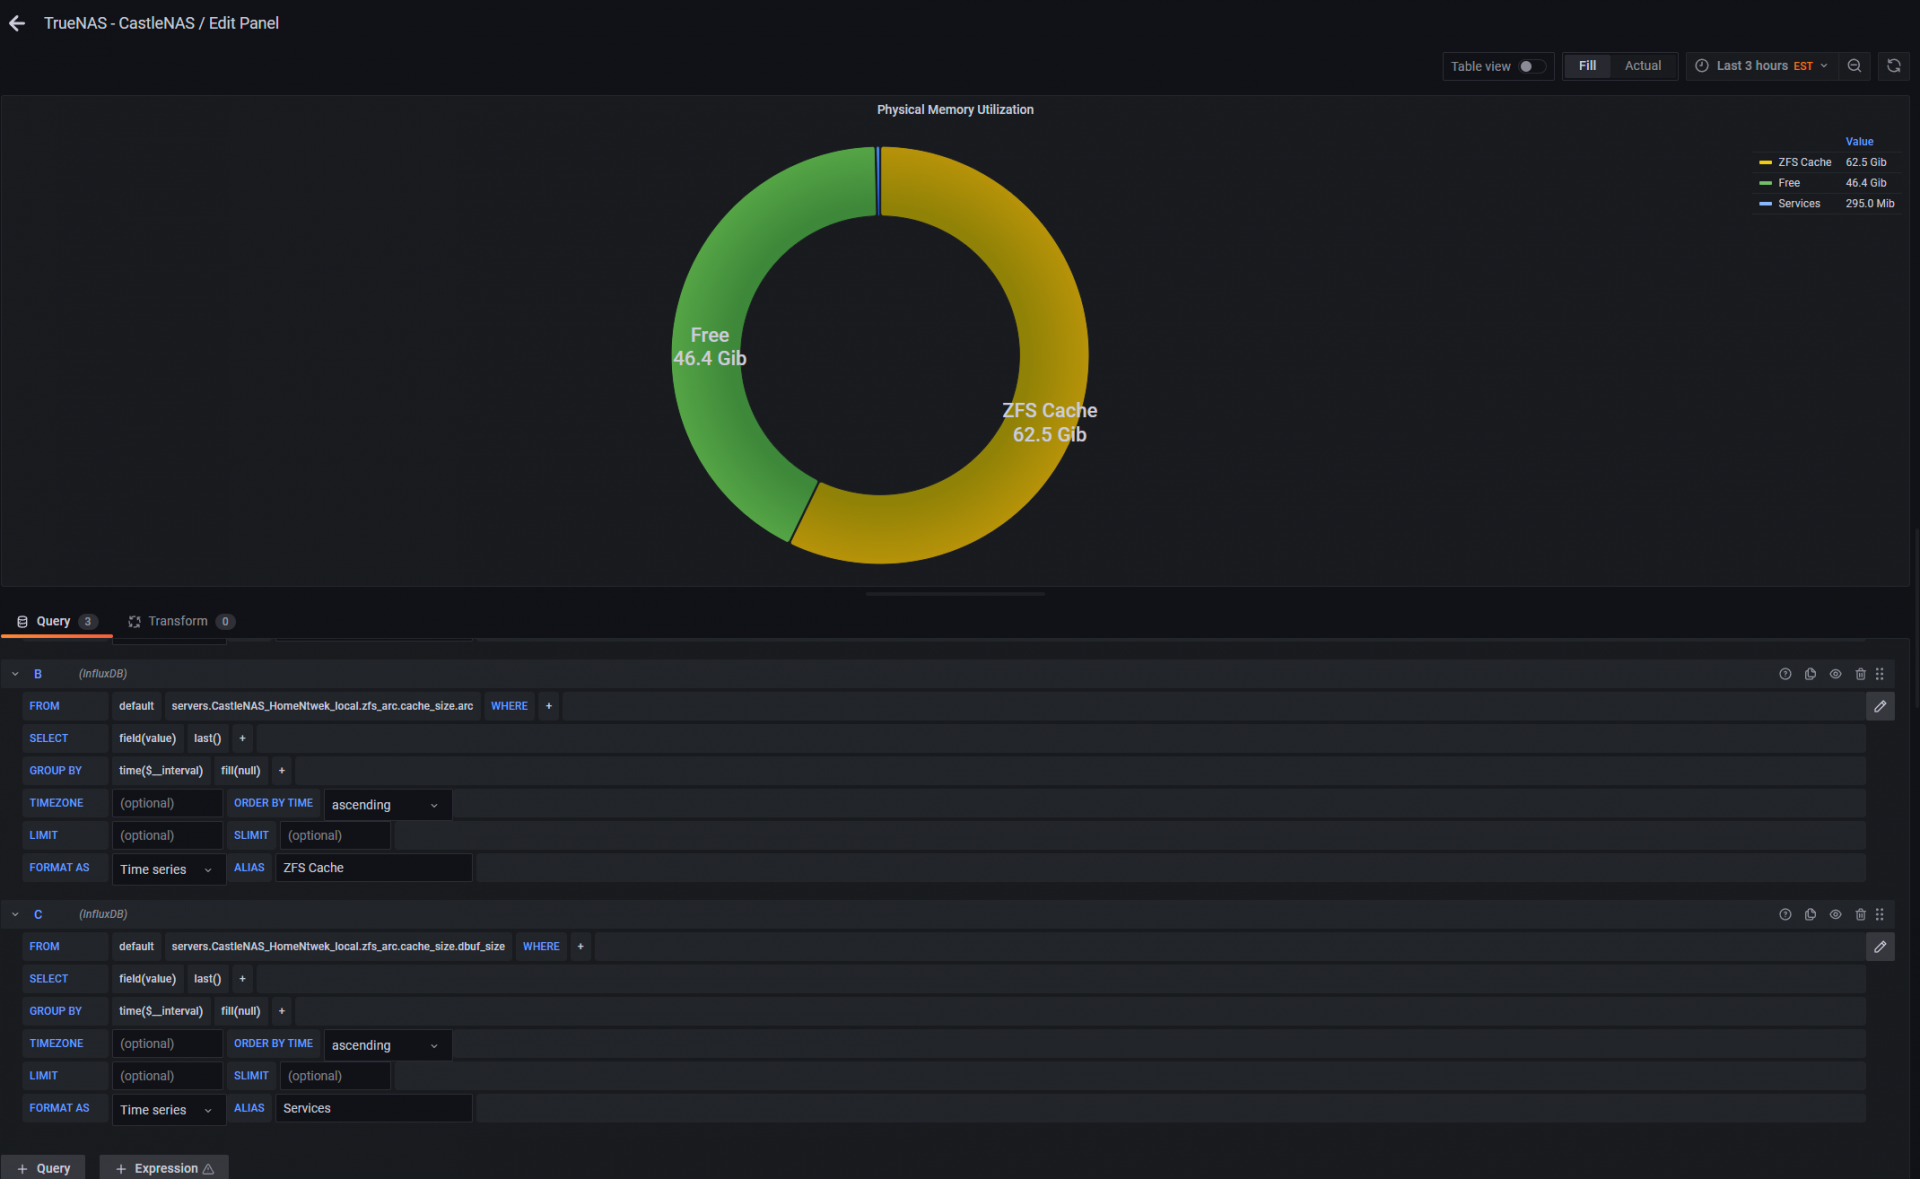
I built this out:

I figured out that free is tied to local.memory.memory.free
and zfs cache size is tied to zfs_arc.cache_size.arc, however for the life of me, I cant figure out what metric shows how much memory services are using, anyone figure out what metric reports on that?
Thanks!
First off thanks to anyone who takes the time to give me a hand with this, I'm building a customized Grafana dashboard based off of the one given for free off of Grafana's site.
I got almost everything working, but I cant seem to find the metrics for the amount of memory that services are using to match up with whats showing up on the main page of truenas itself:
as you can see here, services are using about 19GB.
I built this out:
I figured out that free is tied to local.memory.memory.free
and zfs cache size is tied to zfs_arc.cache_size.arc, however for the life of me, I cant figure out what metric shows how much memory services are using, anyone figure out what metric reports on that?
Thanks!
