"bad performance" on large file transfers

ggiinnoo

Dabbler
Joined
Sep 25, 2022
Messages
24
I always wanted to max out my 10gbe cards in both my nas, and main machine. () YES they are connected to eachother without switch :) )

To achieve this i got a nice little Intel optane 900p 480gb.

But why??? Why not?

I work mostly with big files. Think of movie rips, 1080p, 4k and lots of raw pictures.

The NAS hardware:
Code:
Motherboard: Gigabyte Z370 AORUS GAMING 7-OP
cpu: Intel I7 8086k
ram: 64gb DDR4 corsair LPX

drives:
4 x seagate ironwolf 8tb
4 x WD red plus 4tb
Connected to LSI 9240-8i IT

Intel optane 32gb boot drive
Intel optane 900p 480gb

HP/Intel X540-T2


The workstation:
Code:
Threadripper 24 cores.
64GB ddr4

corsair force mp600 1tb

HP/Intel X540-T2


ALRIGHT,

First some basics tests...

Iperf, i did 3 tests, with a couple of minutes in between:
Code:
RUN 1:
WS:
------------------------------------------------------------
Client connecting to 10.10.1.2, TCP port 5001
TCP window size: 9.77 KByte (WARNING: requested 4.88 KByte)
------------------------------------------------------------
[  3] local 172.22.62.138 port 57874 connected with 10.10.1.2 port 5001
[ ID] Interval       Transfer     Bandwidth
[  3]  0.0-10.0 sec  1.16 GBytes   994 Mbits/sec

NAS:
[  1] local 10.10.1.2 port 5001 connected with 10.10.1.3 port 52066
[ ID] Interval       Transfer     Bandwidth
[  1] 0.00-10.00 sec  1.16 GBytes   994 Mbits/sec

RUN 2:
WS:
------------------------------------------------------------
Client connecting to 10.10.1.2, TCP port 5001
TCP window size: 9.77 KByte (WARNING: requested 4.88 KByte)
------------------------------------------------------------
[  3] local 172.22.62.138 port 57876 connected with 10.10.1.2 port 5001
[ ID] Interval       Transfer     Bandwidth
[  3]  0.0-10.0 sec  1.21 GBytes  1.04 Gbits/sec

NAS:
[  2] local 10.10.1.2 port 5001 connected with 10.10.1.3 port 52068
[ ID] Interval       Transfer     Bandwidth
[  2] 0.00-10.02 sec  1.21 GBytes  1.04 Gbits/sec

RUN 3:
WS:
------------------------------------------------------------
Client connecting to 10.10.1.2, TCP port 5001
TCP window size: 9.77 KByte (WARNING: requested 4.88 KByte)
------------------------------------------------------------
[  3] local 172.22.62.138 port 57878 connected with 10.10.1.2 port 5001
[ ID] Interval       Transfer     Bandwidth
[  3]  0.0-10.0 sec  1.11 GBytes   950 Mbits/sec

NAS:
[  3] local 10.10.1.2 port 5001 connected with 10.10.1.3 port 52070
[ ID] Interval       Transfer     Bandwidth
[  3] 0.00-10.00 sec  1.11 GBytes   949 Mbits/sec


So networking doesn't seem to be the issue. Next stop, log SSD.

Basic smartctl check gives us the following:

Code:
smartctl 7.2 2021-09-14 r5236 [FreeBSD 13.1-RELEASE-p2 amd64] (local build)
Copyright (C) 2002-20, Bruce Allen, Christian Franke, www.smartmontools.org

=== START OF INFORMATION SECTION ===
Model Number:                       INTEL SSDPED1D480GA
Serial Number:                      PHMB751000N0480DGN
Firmware Version:                   E2010435
PCI Vendor/Subsystem ID:            0x8086
IEEE OUI Identifier:                0x5cd2e4
Controller ID:                      0
NVMe Version:                       <1.2
Number of Namespaces:               1
Namespace 1 Size/Capacity:          480,103,981,056 [480 GB]
Namespace 1 Formatted LBA Size:     512
Local Time is:                      Thu Dec  1 00:01:45 2022 CET
Firmware Updates (0x02):            1 Slot
Optional Admin Commands (0x0007):   Security Format Frmw_DL
Optional NVM Commands (0x0006):     Wr_Unc DS_Mngmt
Log Page Attributes (0x02):         Cmd_Eff_Lg
Maximum Data Transfer Size:         32 Pages

Supported Power States
St Op     Max   Active     Idle   RL RT WL WT  Ent_Lat  Ex_Lat
 0 +    18.00W       -        -    0  0  0  0        0       0

Supported LBA Sizes (NSID 0x1)
Id Fmt  Data  Metadt  Rel_Perf
 0 +     512       0         2

=== START OF SMART DATA SECTION ===
SMART overall-health self-assessment test result: PASSED

SMART/Health Information (NVMe Log 0x02)
Critical Warning:                   0x00
Temperature:                        41 Celsius
Available Spare:                    100%
Available Spare Threshold:          0%
Percentage Used:                    0%
Data Units Read:                    5,947,696 [3.04 TB]
Data Units Written:                 33,512,722 [17.1 TB]
Host Read Commands:                 223,213,231
Host Write Commands:                500,078,378
Controller Busy Time:               178
Power Cycles:                       448
Power On Hours:                     2,471
Unsafe Shutdowns:                   210
Media and Data Integrity Errors:    0
Error Information Log Entries:      0

Error Information (NVMe Log 0x01, 16 of 64 entries)
No Errors Logged


Not hot, not cold and no error's, great. Next some speed tests.

I did a 3 tests to make sure the results aren't bad:
Code:
Test 1:
/dev/nvd1
        512             # sectorsize
        480103981056    # mediasize in bytes (447G)
        937703088       # mediasize in sectors
        0               # stripesize
        0               # stripeoffset
        INTEL SSDPED1D480GA     # Disk descr.
        PHMB751000N0480DGN      # Disk ident.
        nvme1           # Attachment
        Yes             # TRIM/UNMAP support
        0               # Rotation rate in RPM

Synchronous random writes:
         0.5 kbytes:     28.1 usec/IO =     17.4 Mbytes/s
           1 kbytes:     29.5 usec/IO =     33.2 Mbytes/s
           2 kbytes:     28.6 usec/IO =     68.4 Mbytes/s
           4 kbytes:     27.2 usec/IO =    143.7 Mbytes/s
           8 kbytes:     27.5 usec/IO =    283.8 Mbytes/s
          16 kbytes:     17.0 usec/IO =    917.6 Mbytes/s
          32 kbytes:     41.6 usec/IO =    751.4 Mbytes/s
          64 kbytes:     56.1 usec/IO =   1114.9 Mbytes/s
         128 kbytes:     91.0 usec/IO =   1373.0 Mbytes/s
         256 kbytes:    167.1 usec/IO =   1495.9 Mbytes/s
         512 kbytes:    270.4 usec/IO =   1849.2 Mbytes/s
        1024 kbytes:    474.1 usec/IO =   2109.2 Mbytes/s
        2048 kbytes:    899.6 usec/IO =   2223.1 Mbytes/s
        4096 kbytes:   1743.7 usec/IO =   2294.0 Mbytes/s
        8192 kbytes:   3419.7 usec/IO =   2339.4 Mbytes/s

Test 2:
/dev/nvd1
        512             # sectorsize
        480103981056    # mediasize in bytes (447G)
        937703088       # mediasize in sectors
        0               # stripesize
        0               # stripeoffset
        INTEL SSDPED1D480GA     # Disk descr.
        PHMB751000N0480DGN      # Disk ident.
        nvme1           # Attachment
        Yes             # TRIM/UNMAP support
        0               # Rotation rate in RPM

Synchronous random writes:
         0.5 kbytes:     28.1 usec/IO =     17.4 Mbytes/s
           1 kbytes:     28.1 usec/IO =     34.7 Mbytes/s
           2 kbytes:     28.4 usec/IO =     68.7 Mbytes/s
           4 kbytes:     25.8 usec/IO =    151.6 Mbytes/s
           8 kbytes:     27.7 usec/IO =    281.7 Mbytes/s
          16 kbytes:     17.0 usec/IO =    916.7 Mbytes/s
          32 kbytes:     39.2 usec/IO =    797.9 Mbytes/s
          64 kbytes:     55.3 usec/IO =   1130.9 Mbytes/s
         128 kbytes:    110.2 usec/IO =   1134.0 Mbytes/s
         256 kbytes:    171.7 usec/IO =   1456.0 Mbytes/s
         512 kbytes:    272.3 usec/IO =   1836.5 Mbytes/s
        1024 kbytes:    476.1 usec/IO =   2100.5 Mbytes/s
        2048 kbytes:    893.5 usec/IO =   2238.4 Mbytes/s
        4096 kbytes:   1738.1 usec/IO =   2301.3 Mbytes/s
        8192 kbytes:   3417.4 usec/IO =   2341.0 Mbytes/s

Test 3:
/dev/nvd1
        512             # sectorsize
        480103981056    # mediasize in bytes (447G)
        937703088       # mediasize in sectors
        0               # stripesize
        0               # stripeoffset
        INTEL SSDPED1D480GA     # Disk descr.
        PHMB751000N0480DGN      # Disk ident.
        nvme1           # Attachment
        Yes             # TRIM/UNMAP support
        0               # Rotation rate in RPM

Synchronous random writes:
         0.5 kbytes:     27.0 usec/IO =     18.1 Mbytes/s
           1 kbytes:     28.0 usec/IO =     34.9 Mbytes/s
           2 kbytes:     28.4 usec/IO =     68.8 Mbytes/s
           4 kbytes:     25.7 usec/IO =    152.2 Mbytes/s
           8 kbytes:     27.4 usec/IO =    284.7 Mbytes/s
          16 kbytes:     32.6 usec/IO =    479.2 Mbytes/s
          32 kbytes:     23.8 usec/IO =   1314.3 Mbytes/s
          64 kbytes:     55.4 usec/IO =   1127.6 Mbytes/s
         128 kbytes:    111.3 usec/IO =   1123.5 Mbytes/s
         256 kbytes:    167.6 usec/IO =   1491.9 Mbytes/s
         512 kbytes:    268.8 usec/IO =   1860.4 Mbytes/s
        1024 kbytes:    476.0 usec/IO =   2101.0 Mbytes/s
        2048 kbytes:    896.6 usec/IO =   2230.6 Mbytes/s
        4096 kbytes:   1720.2 usec/IO =   2325.3 Mbytes/s
        8192 kbytes:   3419.5 usec/IO =   2339.5 Mbytes/s


Great results.

Just to be sure, lets test the local drive in the workstation. It might be as simple as that.
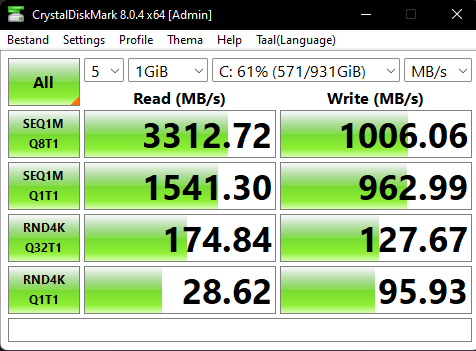
foto2.png

It looks to be fine..

Adding the drive as a log device to the pool:
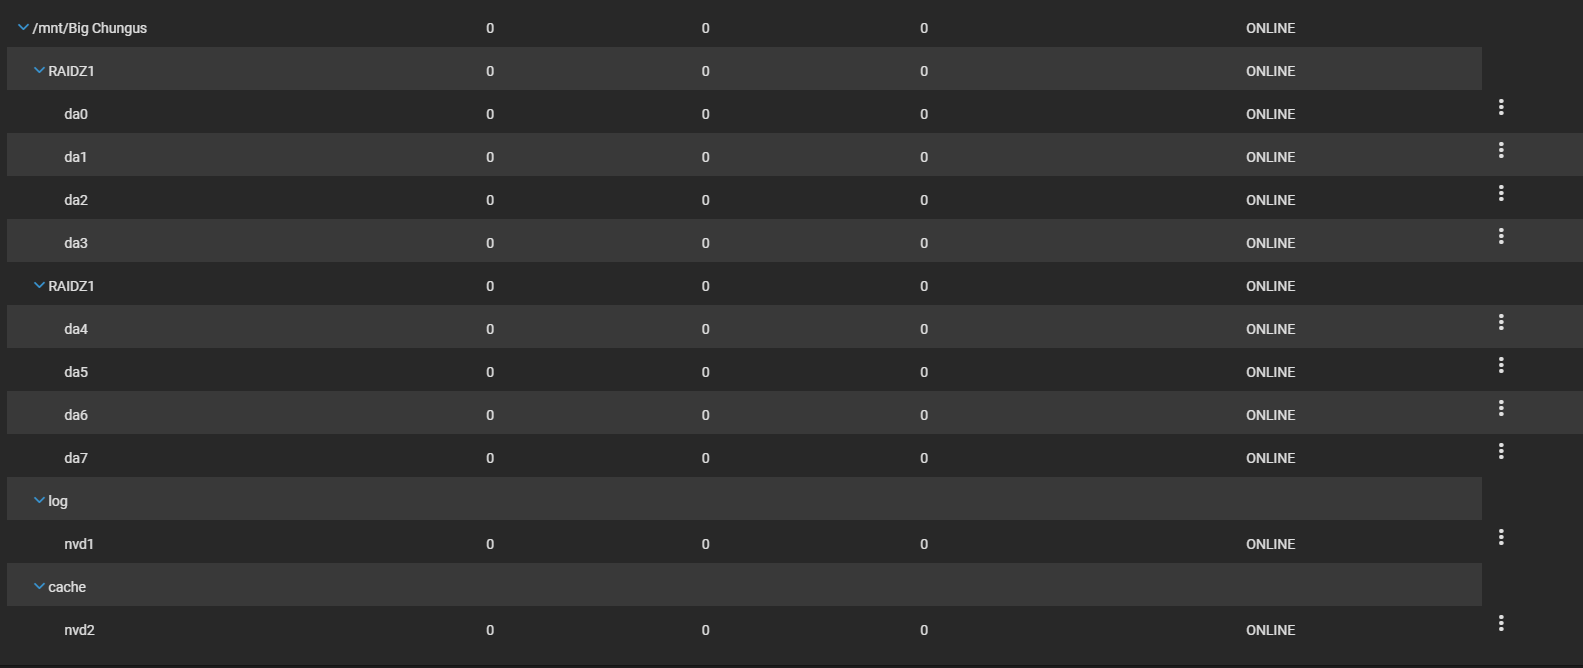
foto1.png


I edit the dataset to set `sync` to `always`, And `compression level` to `OFF`.
foto3.png


Now let's do a file transfer, i used Choeasycopy to sync a folder with 1 26gb mkv file.
With the transfer going i took a look at gstat -p, this shows me that the optane disk IS being used but only ( for the max that i've seen ) 41%. I took a screenshot to give an idee of the process.
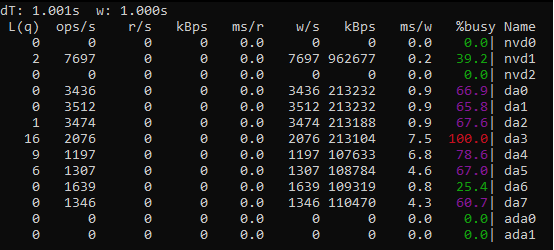
foto4.png


robo copy results:
Code:

               Total    Copied   Skipped  Mismatch    FAILED    Extras
    Dirs :         1         1         1         0         0         0
   Files :         1         1         0         0         0         0
   Bytes :  26.115 g  26.115 g         0         0         0         0
   Times :   0:01:10   0:00:17                       0:00:00   0:00:17


   Speed :           1.601.062.714 Bytes/sec.
   Speed :               91613,547 MegaBytes/min.
   Ended : donderdag 1 december 2022 10:39:16


Copying the file in the file explorer to the nas results in the following speed:
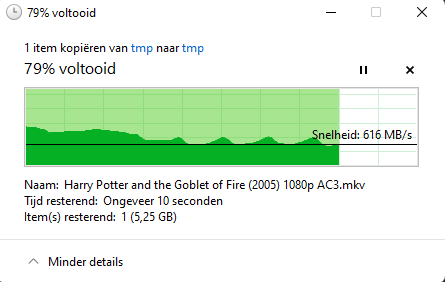
foto5.png


It starts of good, 1gb a sec. But then goes down to as low as 550mb/sec.

My understanding with `sync` set to `always` is that it forces the transfer to the log device. The log device being fast enough to handle a large file transfer should be 'easy' to sustain a 10gbit transfer.
 

sretalla

Powered by Neutrality
Moderator
Joined
Jan 1, 2016
Messages
9,703

ggiinnoo

Dabbler
Joined
Sep 25, 2022
Messages
24
That does not seems fine no. I read GB, but it is not. I will do some futher testing.
 

ggiinnoo

Dabbler
Joined
Sep 25, 2022
Messages
24
I checked what i did wrong and it was a problem of WSL.
Now using the iperf2 for windows, i get the following results:


This used a tcp windows size of 512kb
Code:
WS:
------------------------------------------------------------
Client connecting to 10.10.1.2, TCP port 5001
TCP window size:  512 KByte
------------------------------------------------------------
[  3] local 10.10.1.3 port 55853 connected with 10.10.1.2 port 5001
[ ID] Interval       Transfer     Bandwidth
[  3]  0.0- 1.0 sec   718 MBytes  6.02 Gbits/sec
[  3]  1.0- 2.0 sec   733 MBytes  6.15 Gbits/sec
[  3]  2.0- 3.0 sec   799 MBytes  6.71 Gbits/sec
[  3]  3.0- 4.0 sec  1.07 GBytes  9.18 Gbits/sec
[  3]  4.0- 5.0 sec  1.06 GBytes  9.13 Gbits/sec
[  3]  5.0- 6.0 sec  1.07 GBytes  9.18 Gbits/sec
[  3]  6.0- 7.0 sec  1.08 GBytes  9.29 Gbits/sec
[  3]  7.0- 8.0 sec  1.02 GBytes  8.75 Gbits/sec
[  3]  8.0- 9.0 sec  1019 MBytes  8.55 Gbits/sec
[  3]  0.0-10.0 sec  9.57 GBytes  8.22 Gbits/sec
[  3] MSS and MTU size unknown (TCP_MAXSEG not supported by OS?)

NAS:
------------------------------------------------------------
Server listening on TCP port 5001
TCP window size:  512 KByte
------------------------------------------------------------
[  1] local 10.10.1.2 port 5001 connected with 10.10.1.3 port 55853
[ ID] Interval       Transfer     Bandwidth
[  1] 0.00-10.01 sec  9.57 GBytes  8.21 Gbits/sec


Now a 1MB one:
Code:
WS:
------------------------------------------------------------
Client connecting to 10.10.1.2, TCP port 5001
TCP window size: 1.00 MByte
------------------------------------------------------------
[  3] local 10.10.1.3 port 55866 connected with 10.10.1.2 port 5001
[ ID] Interval       Transfer     Bandwidth
[  3]  0.0- 1.0 sec  1.10 GBytes  9.45 Gbits/sec
[  3]  1.0- 2.0 sec  1.10 GBytes  9.49 Gbits/sec
[  3]  2.0- 3.0 sec  1.10 GBytes  9.49 Gbits/sec
[  3]  3.0- 4.0 sec  1.10 GBytes  9.49 Gbits/sec
[  3]  4.0- 5.0 sec  1.10 GBytes  9.48 Gbits/sec
[  3]  5.0- 6.0 sec  1.10 GBytes  9.48 Gbits/sec
[  3]  6.0- 7.0 sec  1.10 GBytes  9.48 Gbits/sec
[  3]  7.0- 8.0 sec  1.10 GBytes  9.49 Gbits/sec
[  3]  8.0- 9.0 sec  1.10 GBytes  9.49 Gbits/sec
[  3]  0.0-10.0 sec  11.0 GBytes  9.48 Gbits/sec
[  3] MSS and MTU size unknown (TCP_MAXSEG not supported by OS?)

NAS:
------------------------------------------------------------
Server listening on TCP port 5001
TCP window size: 1.00 MByte
------------------------------------------------------------
[  1] local 10.10.1.2 port 5001 connected with 10.10.1.3 port 55866
[ ID] Interval       Transfer     Bandwidth
[  1] 0.00-10.01 sec  11.0 GBytes  9.47 Gbits/sec


Converting 8.75 Gbit to GB, i get 1,08 GB/sec. Good


Trying 386kb:
Code:
WS:
------------------------------------------------------------
Client connecting to 10.10.1.2, TCP port 5001
TCP window size:  386 KByte
------------------------------------------------------------
[  3] local 10.10.1.3 port 56062 connected with 10.10.1.2 port 5001
[ ID] Interval       Transfer     Bandwidth
[  3]  0.0- 1.0 sec   718 MBytes  6.03 Gbits/sec
[  3]  1.0- 2.0 sec  1014 MBytes  8.51 Gbits/sec
[  3]  2.0- 3.0 sec  1.07 GBytes  9.18 Gbits/sec
[  3]  3.0- 4.0 sec  1.07 GBytes  9.15 Gbits/sec
[  3]  4.0- 5.0 sec  1.08 GBytes  9.32 Gbits/sec
[  3]  5.0- 6.0 sec  1.06 GBytes  9.13 Gbits/sec
[  3]  6.0- 7.0 sec  1.09 GBytes  9.35 Gbits/sec
[  3]  7.0- 8.0 sec  1.08 GBytes  9.27 Gbits/sec
[  3]  8.0- 9.0 sec  1.06 GBytes  9.10 Gbits/sec
[  3]  9.0-10.0 sec  1.06 GBytes  9.08 Gbits/sec
[  3]  0.0-10.0 sec  10.3 GBytes  8.81 Gbits/sec
[  3] MSS and MTU size unknown (TCP_MAXSEG not supported by OS?)

NAS:
------------------------------------------------------------
Server listening on TCP port 5001
TCP window size:  386 KByte
------------------------------------------------------------
[  1] local 10.10.1.2 port 5001 connected with 10.10.1.3 port 56062
[ ID] Interval       Transfer     Bandwidth
[  1] 0.00-10.01 sec  10.3 GBytes  8.81 Gbits/sec


Until i went to 256kb, the results were good:
Code:
WS:
------------------------------------------------------------
Client connecting to 10.10.1.2, TCP port 5001
TCP window size:  256 KByte
------------------------------------------------------------
[  3] local 10.10.1.3 port 55987 connected with 10.10.1.2 port 5001
[ ID] Interval       Transfer     Bandwidth
[  3]  0.0- 1.0 sec   376 MBytes  3.16 Gbits/sec
[  3]  1.0- 2.0 sec   377 MBytes  3.16 Gbits/sec
[  3]  2.0- 3.0 sec   377 MBytes  3.16 Gbits/sec
[  3]  3.0- 4.0 sec   377 MBytes  3.16 Gbits/sec
[  3]  4.0- 5.0 sec   377 MBytes  3.16 Gbits/sec
[  3]  5.0- 6.0 sec   377 MBytes  3.16 Gbits/sec
[  3]  6.0- 7.0 sec   377 MBytes  3.16 Gbits/sec
[  3]  7.0- 8.0 sec   377 MBytes  3.16 Gbits/sec
[  3]  8.0- 9.0 sec   377 MBytes  3.16 Gbits/sec
[  3]  9.0-10.0 sec   377 MBytes  3.16 Gbits/sec
[  3]  0.0-10.0 sec  3.68 GBytes  3.16 Gbits/sec
[  3] MSS and MTU size unknown (TCP_MAXSEG not supported by OS?)

NAS:
------------------------------------------------------------
Server listening on TCP port 5001
TCP window size:  256 KByte
------------------------------------------------------------
[  1] local 10.10.1.2 port 5001 connected with 10.10.1.3 port 55987
[ ID] Interval       Transfer     Bandwidth
[  1] 0.00-10.01 sec  3.68 GBytes  3.16 Gbits/sec


I don't realy know untill what tcp window size i should see 10gbe. But looking at these results, it should be fine.

I realy hoped it was just a bad cable, but no :frown:
 

HoneyBadger

actually does care
Administrator
Moderator
iXsystems
Joined
Feb 6, 2014
Messages
5,112
My understanding with `sync` set to `always` is that it forces the transfer to the log device. The log device being fast enough to handle a large file transfer should be 'easy' to sustain a 10gbit transfer.

This is correct; but then your log device has to spool the data off into the pool devices. What you're actually seeing is the underlying performance of your disks, and ~600MB/s is an expected number for your pool configuration (2x 4-wide Z1)

Please see the longer explanation below regarding how the transfer works, involving the "write throttle"


Also note that sync=always is never going to be as fast as asynchronous transfers using sync=standard on this.

If you want to verify that your network and disks are capable of supporting these speeds, remove the log device (and put sync back to standard on your pool!) and create a one-drive pool with the Optane in it. Copies to there should go at the 10Gbps line speed, since the pool device will be able to keep up with the requested writes.
 

ggiinnoo

Dabbler
Joined
Sep 25, 2022
Messages
24
This is correct; but then your log device has to spool the data off into the pool devices. What you're actually seeing is the underlying performance of your disks, and ~600MB/s is an expected number for your pool configuration (2x 4-wide Z1)

Please see the longer explanation below regarding how the transfer works, involving the "write throttle"


Also note that sync=always is never going to be as fast as asynchronous transfers using sync=standard on this.

If you want to verify that your network and disks are capable of supporting these speeds, remove the log device (and put sync back to standard on your pool!) and create a one-drive pool with the Optane in it. Copies to there should go at the 10Gbps line speed, since the pool device will be able to keep up with the requested writes.

Thank's for the link!
It seems about right that when there is enough "dirty data" the speed slows down. I did wonder why the speeds looked like that of the drives, make sense now.

I also removed the log device, made a pool with it and also created a smb share. and tadaa, 1GB/s:
speedy-af.png

So no issues with the workstation, cabling and nas in general.


There is no way to enlarge the "dirty data" treshhold?!? If not, what would be the correct way to sustain fast transfer rate with large files.
 

HoneyBadger

actually does care
Administrator
Moderator
iXsystems
Joined
Feb 6, 2014
Messages
5,112
There is no way to enlarge the "dirty data" treshhold?!?

You absolutely can, the tunable is type sysctl, name vfs.zfs.dirty_data_max, with a value measured in bytes.

We go down a bit of a rabbit hole in this thread: https://www.truenas.com/community/t...s-striped-slog-peculiarity.94268/#post-652310

The important bits to note is that RAM that's been consumed by dirty data is unusable for ARC read cache purposes - if you increase the size of your dirty_data_max to 16GB, then under a heavy write load, ZFS may have to discard up to that same amount of the "least valuable" data in its read cache.
 

ggiinnoo

Dabbler
Joined
Sep 25, 2022
Messages
24
I have now played around with vfs.zfs.dirty_data_max and have it set to 200 ( to much, i know ). Changed the sync to always, and no real difference. After 7 seconds into the transfer it dips. ( The file is 26gb )

I looked into the link you send and saw that the slow will not hold on to new(?) data for longer then 5 seconds so maybe that is then cripling write performance.

The tunable i would probably need is zfs_delay_scale.
But what would be smart, and what of vallue would it require o_O
 

ggiinnoo

Dabbler
Joined
Sep 25, 2022
Messages
24
Reading futher into the documentation of zfs and understanding the variables, i changed vfs.zfs.txg.timeout to 30 seconds.

It looks like it makes a different, but i think there is some other "bottleneck" showing it's face:
pyramid.png


Speeds are hitting of strong but then dip to about 200 - 250mb/sec and then ramp back up to 900+ and then back down again. What gives.. i need to do some futher testing but that's where i am so far.
 

HoneyBadger

actually does care
Administrator
Moderator
iXsystems
Joined
Feb 6, 2014
Messages
5,112
I have now played around with vfs.zfs.dirty_data_max and have it set to 200 ( to much, i know ).
If you mean "200GB" - yes, that's far too much as it's more than your 64GB of RAM - try 8GiB (8,589,934,592 bytes) instead as that's double the default of 4GiB. See if this change on its own will improve things.

Reading futher into the documentation of zfs and understanding the variables, i changed vfs.zfs.txg.timeout to 30 seconds.
This means the buffer will be allowed to get larger and stay open longer, but you're then causing bigger stalls as you now have a larger amount of data that needs to be flushed out, which shows up as that sawtooth-like graph.
 

ggiinnoo

Dabbler
Joined
Sep 25, 2022
Messages
24
This means the buffer will be allowed to get larger and stay open longer, but you're then causing bigger stalls as you now have a larger amount of data that needs to be flushed out, which shows up as that sawtooth-like graph.

It seems that it fully ignores the 30 sec timeout though. The full transfer takes 25sec. But the stalls are happening after ~7 seconds. So it seems there is another timer in the way.

The 200gb is just for testing and will not be the final number :), i first want to (try) to fully utilize the 10gbit connection
 

HoneyBadger

actually does care
Administrator
Moderator
iXsystems
Joined
Feb 6, 2014
Messages
5,112
It seems that it fully ignores the 30 sec timeout though. The full transfer takes 25sec. But the stalls are happening after ~7 seconds. So it seems there is another timer in the way.

The 200gb is just for testing and will not be the final number :), i first want to (try) to fully utilize the 10gbit connection
It's not a timer but rather a "force txg after N bytes" tunable which is vfs.zfs.dirty_data_sync and defaults to 64MiB.

You can override this, but once again you may end up with a storage system that can ingest a huge swath of data and then go unresponsive while it commits the txg to the pool vdev members.
 
Top