14. Reporting
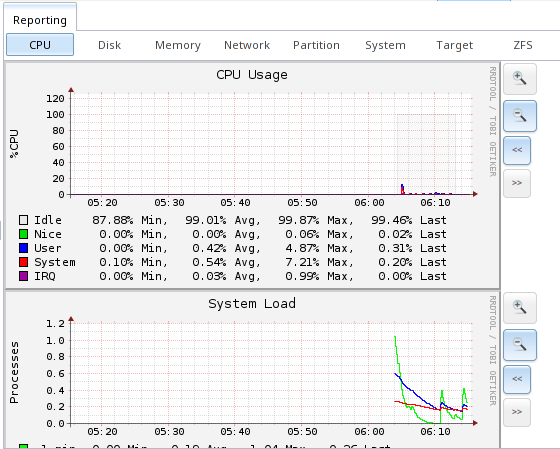
Reporting displays several graphs, as seen in the example in Figure 14a. Click the tab for a device type to see its graphs.
Figure 14a: Reporting Graphs
FreeNAS® uses
collectd
to provide reporting statistics. The following collectd plugins are enabled in /conf/base/etc/local/collectd.conf, and thus provide reporting graphs:
- CPU usage : collects the amount of time spent by the CPU in various states such as executing user code, executing system code, and being idle.
- system load : provides a rough overview of system utilization over a one, five, and fifteen minute average.
- disk : shows the average time a disk I/O operation took to complete.
- physical memory : displays physical memory usage.
- swap utilization : displays the amount of free and used swap space.
- interface : shows received and transmitted traffic in bits per second for each configured interface.
- disk space : displays free and used space for each volume and dataset. However, the disk space used by an individual zvol is not displayed as it is a block device.
- processes : displays the number of processes, grouped by state.
- uptime : keeps track of the system uptime, the average running time, and the maximum reached uptime.
- target: contains bandwidth statistics for iSCSI ports.
- zfs : shows ARC size, hit ratio, and requests.
Reporting data is saved, allowing you to view and monitor usage trends over time. By default, reporting data is saved to /data/rrd_dir.tar.bz2 and
should be preserved across system upgrades and at shutdown. To instead save this data to the system dataset, check the “Reporting database” box in
.
Use the magnifier buttons next to each graph to increase or decrease the displayed time increment from 10 minutes, hourly, daily, weekly, or monthly. You can also use the “<<” and “>>” buttons to scroll through the output.