
Hello everybody. There are some big changes coming to the Dashboard and Reports in 11.3 and I wanted to give a little context. This post contains a summary of what is in 11.3 and also what we have planned for 12. The notes about version 12 are included to let you know what we already have on our radar. All this information should give a good overview of where we're at for 11.3 and where we are going for 12. The 11.3 changes are already in the nightlies so you can start testing these now.
What’s new in the Dashboard in 11.3:
Planned Dashboard improvements for FreeNAS 12:

What’s new in Reports in 11.3:
Planned Reporting improvements for FreeNAS 12:

What’s new in the Dashboard in 11.3:
- A complete change in approach. Dashboard no longer shows historical data and instead aims to provide an overview of the current state of the system. Users should use the reports page for historical data.
- Line charts are replaced and consolidated using meters and gauges.
- CPU graphs have been consolidated into a single widget. The CPU widget now provides an average usage stat and per thread stats for both temperature and usage.
- Middleware now handles the stats data and provides the UI with real time events to power the above charts
- Taller cards to accommodate more information and prevent text overflows.
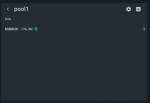
- Interfaces are represented as a separate card per physical NIC unless they are part of a LAGG. Those devices will be incorporated into a LAGG card to avoid redundant UI elements.
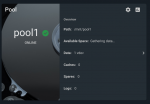
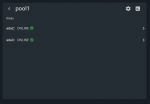
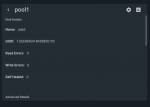
- Pool and Interface widgets feature mobile inspired lateral navigation. Users can “drill down” to get the data they need without leaving the page. This approach also paves the way for a responsive UI for v12.
Planned Dashboard improvements for FreeNAS 12:
- Fully responsive UI.
- Replace last remaining SVG based chart library instances.
- User configurations. Users will be able to configure which widgets are shown on the dashboard. Drag and drop functionality.
- More real time stats. Currently middleware is only providing CPU and Memory related real time stats. We would like to expand on this and provide more stats in this manner. Please put in a feature request on Jira for any real time stats you would like to see in the future.
What’s new in Reports in 11.3:
- Data is now prepared on the backend by the middleware and OS.
- Any remaining data manipulation is done in a web worker, keeping expensive processing off of the main UI thread/context.
- Removed SVG based charting library and replaced it with a canvas based library. The old library was creating in some instances over 200k DOM nodes for just 3 charts. The canvas based approach is GPU accelerated and avoids this problem completely.
- Implemented virtual scroll/lazy loading to prevent overloading of the browser. This also eliminates the need for the pager.
- Users can zoom by X or Y axis. A double click resets the zoom level.
Planned Reporting improvements for FreeNAS 12:
- More performance optimizations.
- Additional filtering options in the top bar.
- Summary items for disks like hottest, fastest disks. This will give users a quick way to find which disks in the pool need to be investigated and what to filter for.
- All charts on page will be synchronized and controlled via global controls.
- Change chart types where appropriate. For example some stats would be better represented with a stacked or area chart type.
Attachments
Last edited:
