Guided examples on using the API

Joined
Jan 4, 2014
Messages
1,644
I look at the API Reference and think to myself 'I wish I knew how to tap into this. Some guided examples would be useful'. On occasion, I browse the guide thinking 'Maybe this time, I'll have a moment of realisation and everything will become clear!' It never does.

Reporting through TC, at present, seems to be limited to using chart widgets.
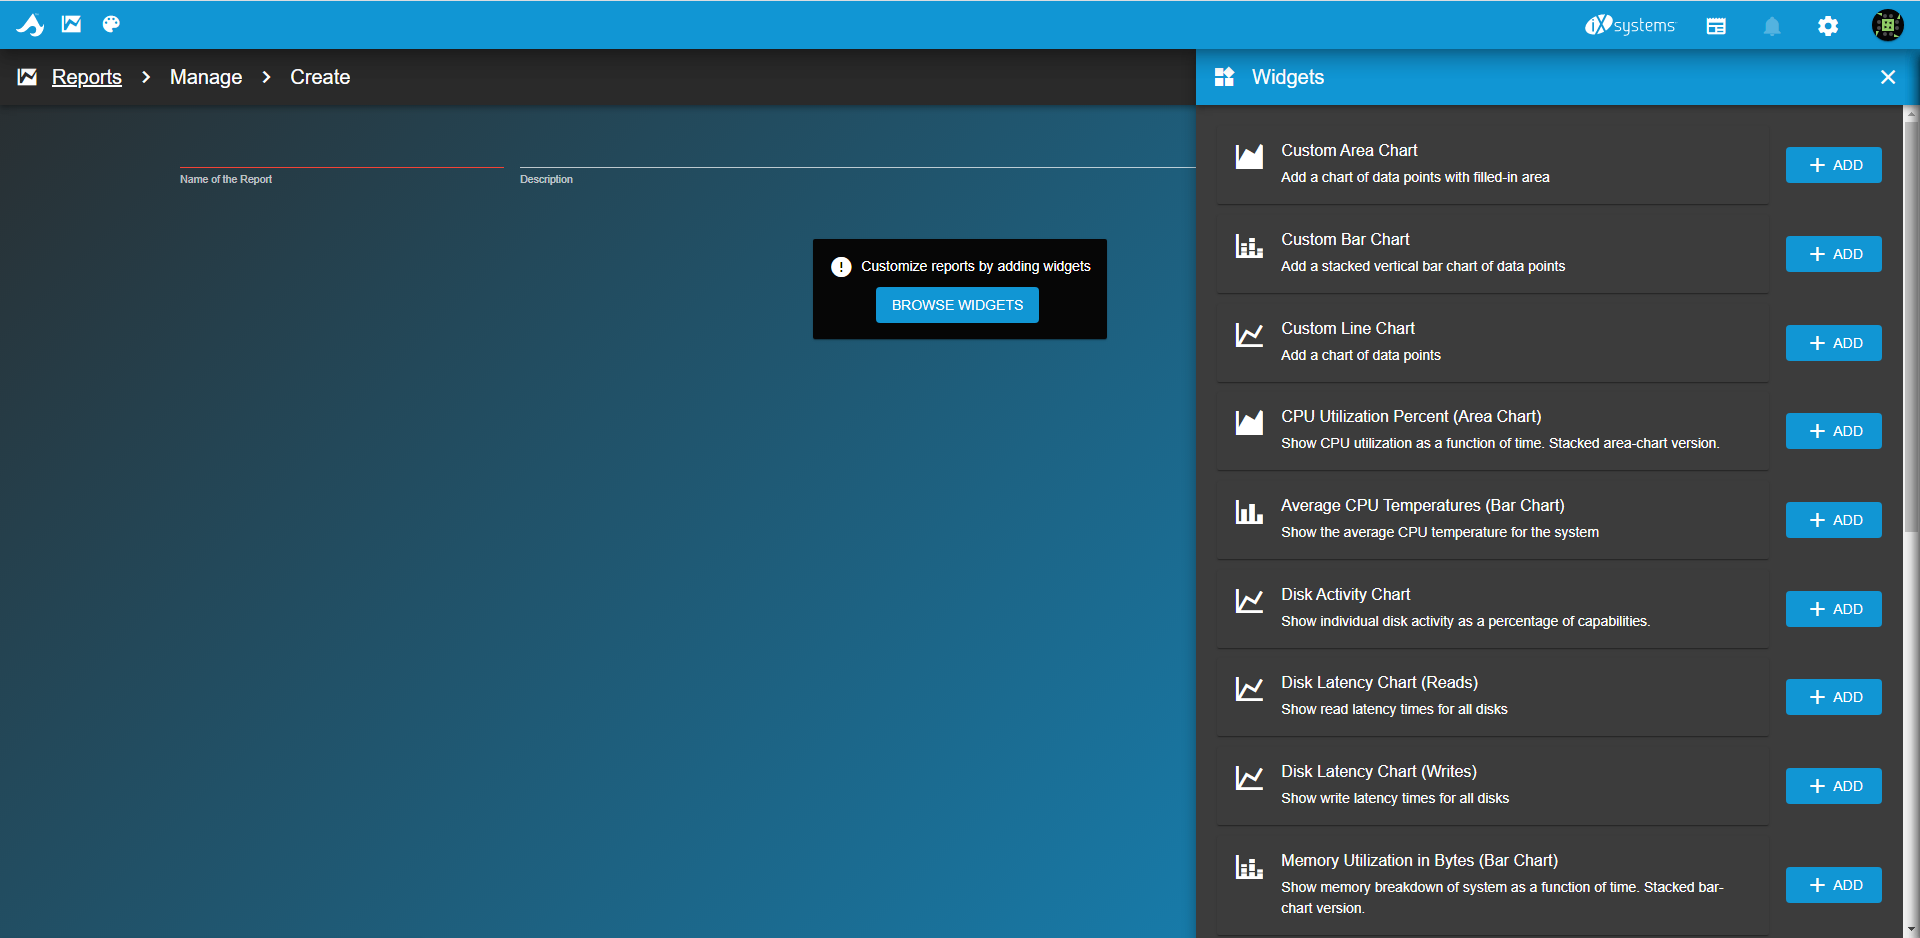
screenshot.427.png


In the API reference, I notice something called List and Text widgets, but again, I have no idea how to tap into these (or whether they're active?).
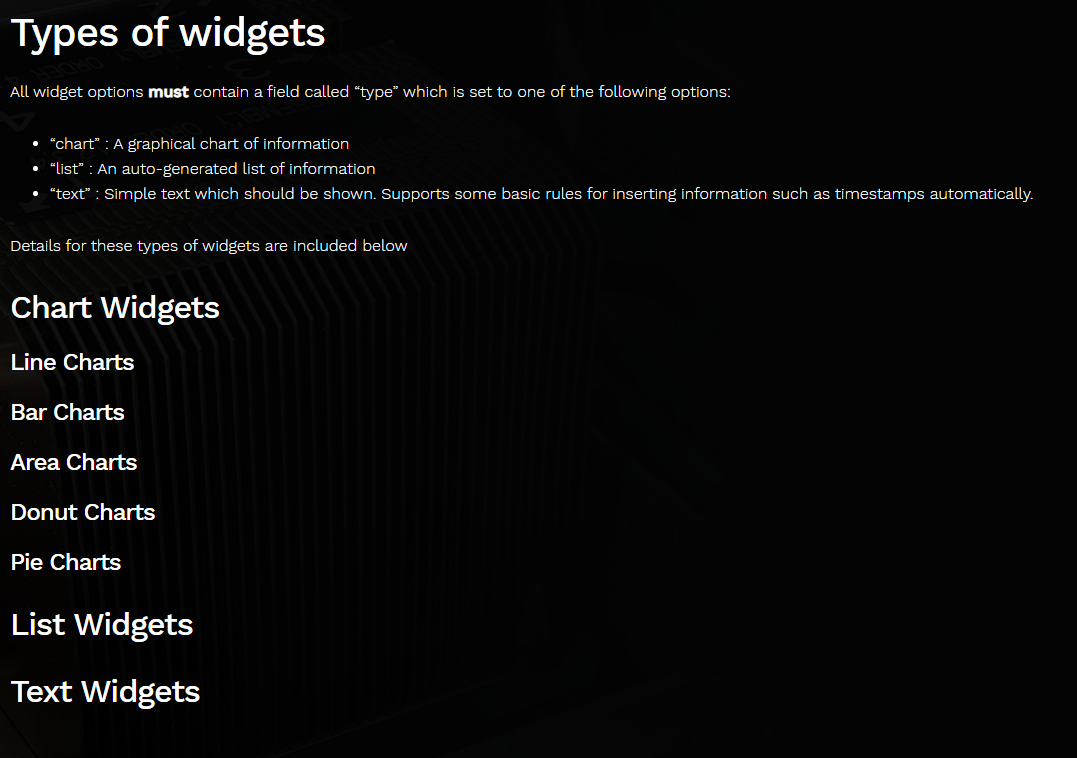
screenshot.426.png


How I'd love to generate a report, through TC, such as this...
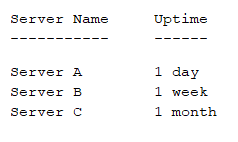
screenshot.428.png


You get the idea. (@aervin You've probably noticed, I have a fixation on uptime stats :tongue:).
 
Last edited:

morganL

Captain Morgan
Administrator
Moderator
iXsystems
Joined
Mar 10, 2018
Messages
2,694
My guess is that after getting current uptime, you'd find that you really want to know more.
How many outages in the last N months?
What were the durations?
When did they occur?
What was the cause? (Known or unknown)

Just because the NAS is up, it does not mean the network was up and the clients could access their data.
Have a think about what you really want to know.... it would be good to get opinions on how best to tackle this issue.

Note that in TC 1.3.1.. there is now on alert on a system being unreachable/down. However, that alert will fire off when a network issue occurs, not just because the NAS is down.
 
Joined
Jan 4, 2014
Messages
1,644
I thought I'd take baby steps first, but you're getting me way too excited now @morganL.

EDIT: At this stage, I'd be happy just to get some pointers on how to tap into the API.

EDIT2: Yes, and that's a very good point that just because a server is up, doesn't mean that clients are able to access the server.
 
Last edited:

aervin

iXsystems
iXsystems
Joined
Jun 13, 2018
Messages
114
Thanks as always for the feedback @Basil Hendroff ! Currently, the reports API is not meant to be useful as a command line reporting tool. The API organizes reporting data into widgets and spits out config objects ready-made for Javascript data-visualization libraries. Reports with chart widgets, for example, will contain Chart.js config objects with the data formatted exactly as the Chart.js library expects. This tight coupling between UI and middleware is a side-effect of offloading heavy computation from the UI to the middleware. This is why the newer reporting feature feels so much snappier when generating reports.

However, the reports API is very flexible. We can create new widget classes easily. I'm not sure if the "Text" and "List" widget types have been fully implemented, but I'm sure we can make them suit your needs. The "List" widget could be a table where every row is a system, and the user defines what data to display in the individual columns, etc. Let us know if this would be adequate for your use-case.
 
Joined
Jan 4, 2014
Messages
1,644
The "List" widget could be a table where every row is a system, and the user defines what data to display in the individual columns, etc. Let us know if this would be adequate for your use-case.
That sounds perfect! I think it would have considerable audience appeal as well, and not just suit my selfish needs.
 
Last edited:

aervin

iXsystems
iXsystems
Joined
Jun 13, 2018
Messages
114
Great! I've been thinking about this thread. For a practical API guide, I'd recommend we start with the servers/list and data/current_stats APIs. The current_stats structure is full of great data about each registered system.
 
Top