CPU: 2x Xeon 2680v3 (12 core, 24 threads each = 24 cores, 48 threads)
FreeNas Version: FreeNAS-11.3-U3.2
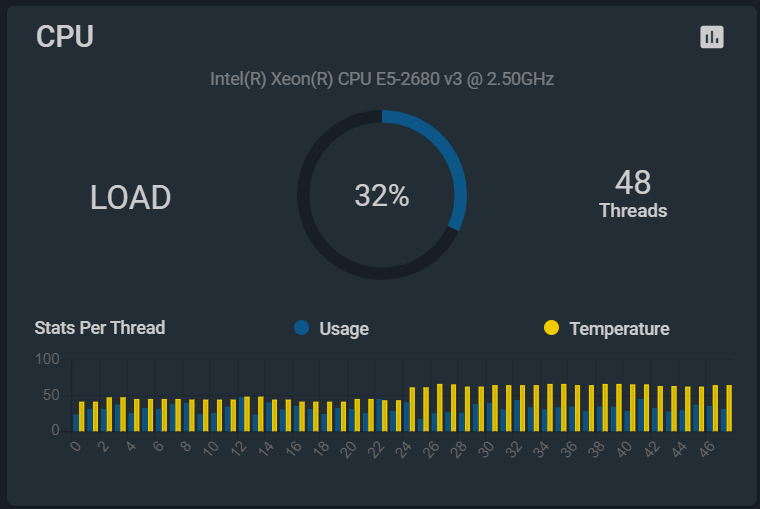
I've got Plex Media Server running in a jail (custom built, not using the plugin). I'm transcoding a movie to optimize for a different resolution. Not surprisingly, that uses a lot of CPU. The dashboard bounces between 30-35% CPU.

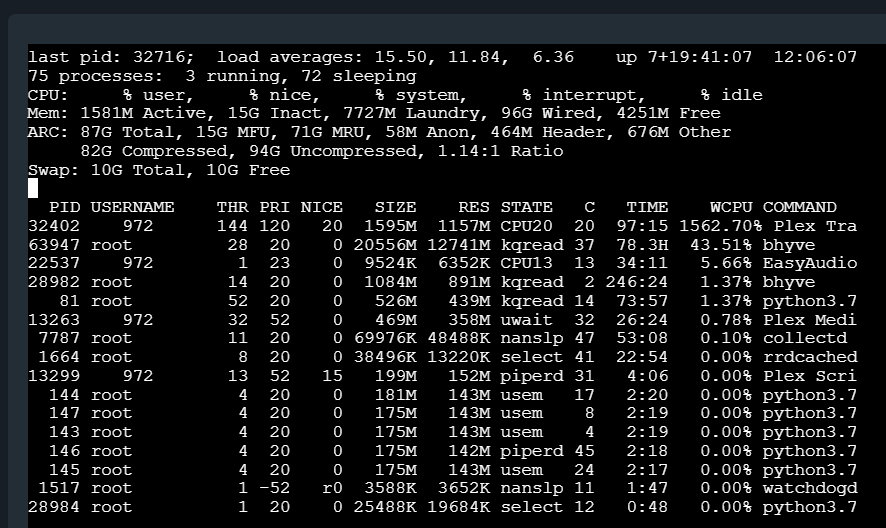
And when I look at active processes, I can indeed see that Plex is chomping through a lot of CPU

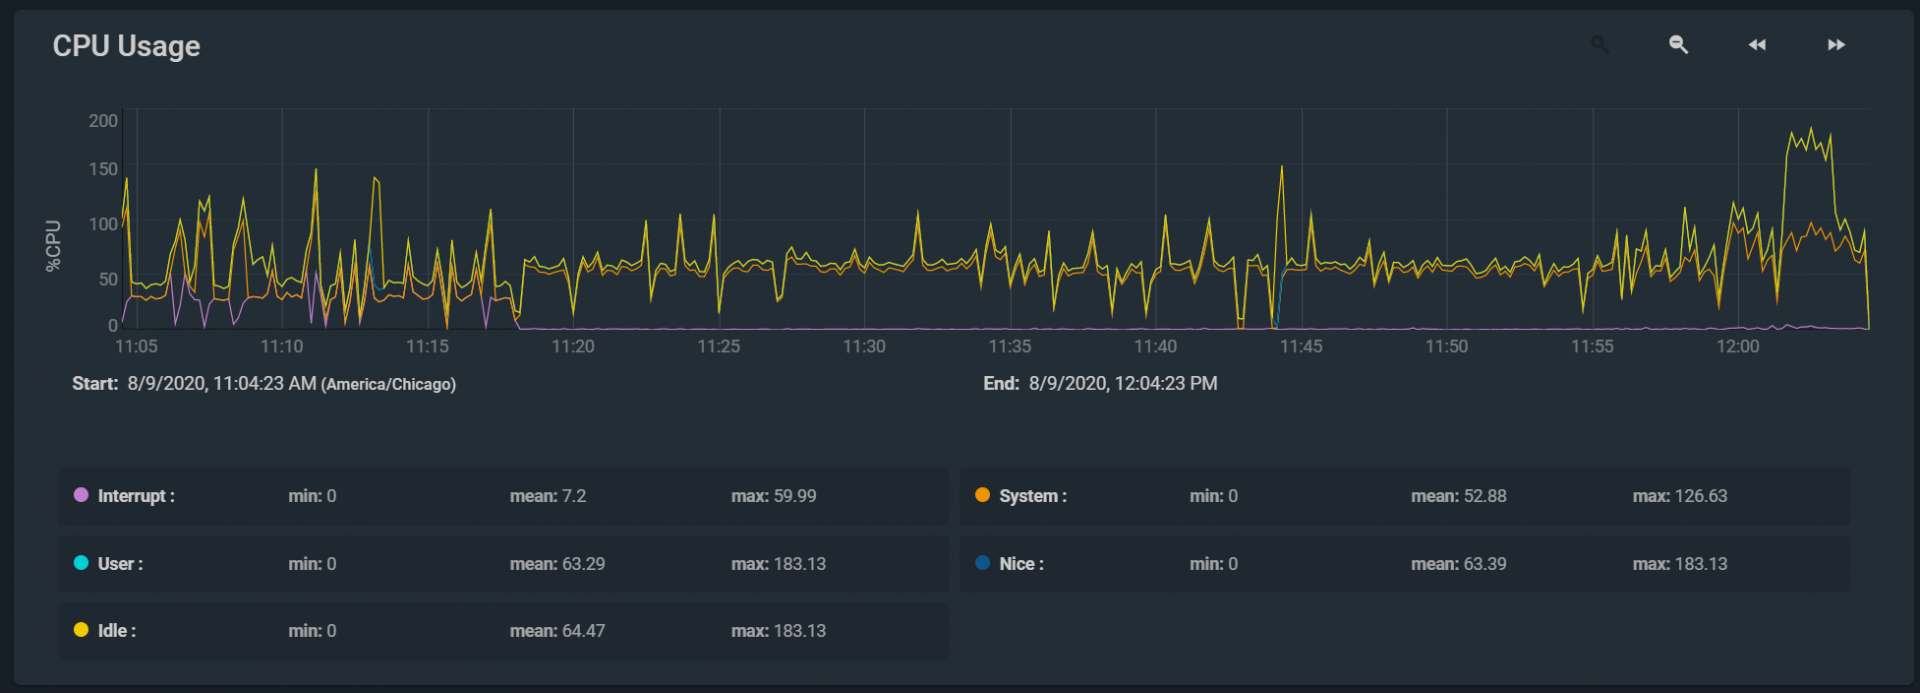
However, when I go to reporting, the CPU is displayed at a really low usage. I would have expected it to be around 1200-1600%. But it's closer to 100%. (Report CPU in percentage is checked, and my understanding is that it should be 100% per core, so my system would cap out around 4800%)

Any idea why these three things don't match? Do I misunderstand how reporting CPU is intended to work?
FreeNas Version: FreeNAS-11.3-U3.2
I've got Plex Media Server running in a jail (custom built, not using the plugin). I'm transcoding a movie to optimize for a different resolution. Not surprisingly, that uses a lot of CPU. The dashboard bounces between 30-35% CPU.
And when I look at active processes, I can indeed see that Plex is chomping through a lot of CPU
However, when I go to reporting, the CPU is displayed at a really low usage. I would have expected it to be around 1200-1600%. But it's closer to 100%. (Report CPU in percentage is checked, and my understanding is that it should be 100% per core, so my system would cap out around 4800%)
Any idea why these three things don't match? Do I misunderstand how reporting CPU is intended to work?
